The shooting star pattern is a simple but powerful signal in trading. It can warn traders that the price may soon reverse downward. This formation usually appears after a strong upward move. A single shooting star candlestick shows that buyers tried to push the price higher but failed. Traders pay attention to this because it reflects a shift in control. By the end of the candle, sellers take over and push the price back down. On its own, this pattern is just an early sign. With confirmation, it can help identify potential reversals more confidently.
What Is a Shooting Star Pattern
The shooting star pattern is a single candlestick formation that signals a potential bearish reversal in the market.
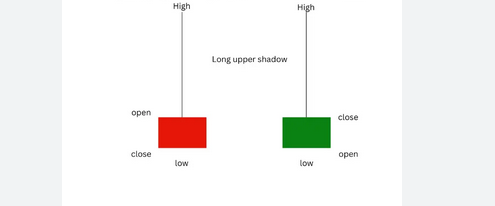
It has a very specific structure. The candle has a small real body near the bottom, a long upper shadow, and little or no lower shadow. This shape is what defines a shooting star candlestick.
The shooting star meaning comes from market behavior. Buyers push the price higher during the session, but cannot hold it there. Sellers step in and drive the price back down before the candle closes.
This pattern usually appears after an uptrend. In that context, it suggests that bullish momentum is weakening and a reversal may follow.
Structure of a Shooting Star Candlestick
The shooting star candlestick has a clear and easy-to-recognize shape. Understanding its structure helps you spot a valid shooting star pattern on the chart.
- Body size. The real body is small and sits near the lower part of the candle. It can be bullish or bearish, but should remain relatively small.
- Upper wick. The key feature. The upper shadow is long, usually at least two times bigger than the body. It shows strong price rejection from higher levels.
- Lower wick. Very small or no wick at all. This means the price closed near the low of the candle.
Visually, the candle looks like an upside-down “T”. This reflects the core shooting star meaning, where buyers lose control and sellers step in.
Shooting Star Meaning in Trading
The shooting star meaning becomes clear when you look at what happens inside the candle step by step.
First, the market is moving up with strong bullish momentum. Buyers are confident and continue pushing the price higher.
Then, during the same candle, sellers enter the market. They reject higher prices and start pushing the price back down.
By the close, the price ends near the low. This shift shows that buyers are losing control, and the shooting star pattern reflects that change in sentiment.
What does it signal?
It can point to a potential reversal, but not always an immediate one. Sometimes the market only pauses before continuing higher.
That is why it is important to separate signal from confirmation. The shooting star candlestick gives a warning, but traders usually wait for extra confirmation before entering a trade.
When Does the Shooting Star Pattern Appear
The shooting star pattern usually forms in specific market conditions. Recognizing the right context makes the signal much more reliable.
- After strong bullish trends. The pattern works best when the market has been moving up clearly. This increases the chance of a reversal.
- At resistance levels. When price reaches a known resistance zone, a shooting star candlestick can show rejection of higher prices.
- During overbought conditions. If the market is overbought, the shooting star meaning becomes stronger as buyers may be exhausted.
Context is key when using this pattern:
- Trend strength. A strong, extended uptrend gives more weight to the signal.
- Volume. Higher volume during the pattern can confirm stronger selling pressure.
- Market structure. Key levels, zones, and previous highs make the pattern more meaningful.
Without the right context, the pattern can give false signals, especially in sideways markets.
Shooting Star vs Other Candlestick Patterns
The shooting star pattern can look similar to other candlesticks, but the context is what makes it different.
- Shooting Star vs Inverted Hammer. They look almost the same, but the shooting star candlestick appears after an uptrend and signals potential bearish reversal. The inverted hammer appears after a downtrend and can signal bullish reversal.
- Shooting Star vs Doji. A doji has almost no real body and shows market indecision. The shooting star pattern has a small body with a clear rejection from the top.
- Shooting Star vs Hanging Man. Both can signal weakness, but the hanging man forms after an uptrend with a small upper wick and long lower wick, while the shooting star has the opposite structure.
These differences are small but important. Misreading them can lead to wrong trade decisions.
How to Identify a Valid Shooting Star Pattern
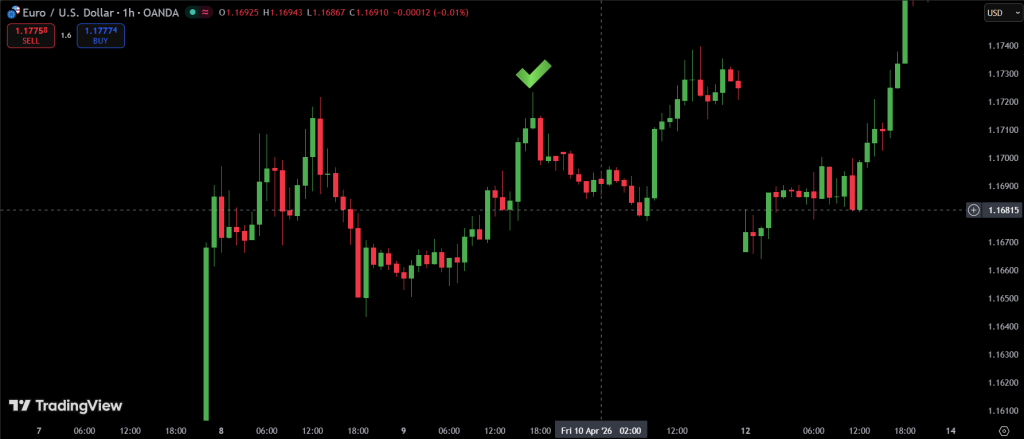
To correctly spot a shooting star pattern, traders should follow a simple checklist. Not every candle with a long wick is a real signal.
- Clear uptrend before the candle. The shooting star candlestick must appear after a noticeable price rise.
- Long upper shadow. The wick should be at least 2 times longer than the body.
- Small real body. The body should be small and located near the bottom of the candle.
- Little or no lower shadow. This shows that price closed near the low.
- Near resistance level. The shooting star meaning becomes stronger when it forms at key resistance.
- Location matters more than shape. Even a perfect candle is weak if it appears in the wrong market context.
This checklist helps filter out weak or false signals and focus only on high-quality setups.
Confirmation of Shooting Star Pattern
The shooting star pattern is not strong enough on its own. Traders usually wait for confirmation before making decisions.
Why confirmation is important?
A single shooting star candlestick only shows rejection of higher prices. It does not guarantee that the market will reverse.
Common confirmation signals:
- Bearish candle after the pattern. A strong red candle after the shooting star supports the bearish idea.
- Break of support. If price breaks a nearby support level, the shooting star becomes more valid.
- Increased volume. Higher volume during or after the pattern shows stronger selling pressure.
- Indicators confirmation. RSI moving down from overbought or MACD turning bearish can support the signal.
Without confirmation, the pattern can easily fail, especially in strong uptrends.
How to Trade the Shooting Star Pattern
The shooting star pattern can be used in different trading styles, but always with risk control.
- Entry strategies:
- Conservative entry: wait for a bearish confirmation candle after the shooting star candlestick
- Aggressive entry: enter immediately after the shooting star closes, but with higher risk
- Stop-loss placement. A common method is placing the stop-loss just above the high of the shooting star wick. This protects against invalid signals.
- Take-profit levels. Targets are often set at previous support zones where price may bounce.
- Risk to reward ratio. Many traders aim for at least 1:2 or better to make the setup worthwhile.
The key idea is simple: the shooting star becomes useful only when combined with discipline and proper trade management.
Common Mistakes Traders Make
The shooting star pattern is simple, but traders often misuse it in real trading.
- Trading without confirmation. Entering immediately after a shooting star candlestick often leads to false signals.
- Ignoring trend context. The shooting star only matters after a strong uptrend. In sideways markets, it loses reliability.
- Confusing with inverted hammer. These candles look similar, but appear in different market contexts and give opposite signals.
- Entering too early. Jumping in before the next candle confirms direction increases risk.
- Poor risk management. Even a correct shooting star pattern can fail, so stop-loss placement is essential.
Avoiding these mistakes helps improve consistency when trading this setup.
Advantages and Limitations
The shooting star pattern is popular because it is easy to understand, but it is not perfect.
Advantages
- Easy to identify on any chart
- Clear visual structure of the shooting star candlestick
- Can signal potential reversals early when the shooting star meaning is confirmed
Limitations
- Can produce false signals in sideways markets
- Requires confirmation to be reliable
- Works best only in the right trend context
This is why traders never rely on the shooting star pattern alone.
Shooting Star Pattern in Different Markets
The shooting star pattern can appear in all major financial markets, but its reliability can vary depending on market behavior.
- Forex. The shooting star candlestick is commonly used in currency trading. It works well on higher timeframes where trends are clearer.
- Stocks. In stock markets, the shooting star meaning is often stronger near earnings or key resistance levels, where strong reactions happen.
- Crypto. Crypto markets are more volatile, so the shooting star pattern can appear often but may give more false signals. Confirmation is especially important here.
Across all markets, the same rule applies: context and confirmation matter more than the pattern itself.
Conclusion
The shooting star pattern is a simple but powerful bearish signal that appears after an uptrend. A single shooting star candlestick shows that buyers tried to push the price higher but were rejected by sellers.
The main idea is not just the shape, but the context. The shooting star becomes important only when it forms at the right level and after a strong move up.
On its own, the pattern is not enough. Confirmation from the next candles, volume, or indicators helps avoid false signals.
In trading, the key lesson is simple: the shooting star pattern works best when combined with patience, confirmation, and risk management.
FAQ
What is a shooting star pattern in trading?
A shooting star pattern is a bearish reversal candlestick that appears after an uptrend and may signal a potential price drop.
Is the shooting star candlestick bullish or bearish?
The shooting star candlestick is considered bearish because it shows rejection of higher prices.
How reliable is the shooting star pattern?
The shooting star becomes more reliable when confirmed by indicators, volume, or a bearish follow-up candle.
What is the difference between shooting star and inverted hammer?
They look similar, but the inverted hammer appears in a downtrend (bullish), while the shooting star pattern appears in an uptrend (bearish).
Can beginners use the shooting star pattern?
Yes, but beginners should always wait for confirmation and use proper risk management when trading the shooting star candlestick.

