
Not every setup that looks like a reversal actually works in real trading. A false hammer pattern can easily appear during strong market movement and trick traders into entering too early. This often leads to losses when price continues in the original direction instead of reversing.
In practice, the problem is not identifying the candle shape, but understanding when it has no real strength behind it. That’s why many traders struggle with fake hammer candlestick situations and repeat the same entry mistakes.
In this article, we’ll focus on real chart behavior: examples of failed setups, false signals, and the most common trading mistakes to avoid.
Real Hammer Candlestick Examples in Different Markets
In real trading, a hammer-style setup can look convincing on many charts, but the outcome is not always the same. Sometimes price reacts strongly and reverses, and sometimes it ignores the signal completely and continues moving in the same direction.
Below are practical hammer pattern examples from different markets, showing how price behaves after the setup forms. The goal is not just to recognize the candle, but to understand what happens next and whether the market actually confirms the move.
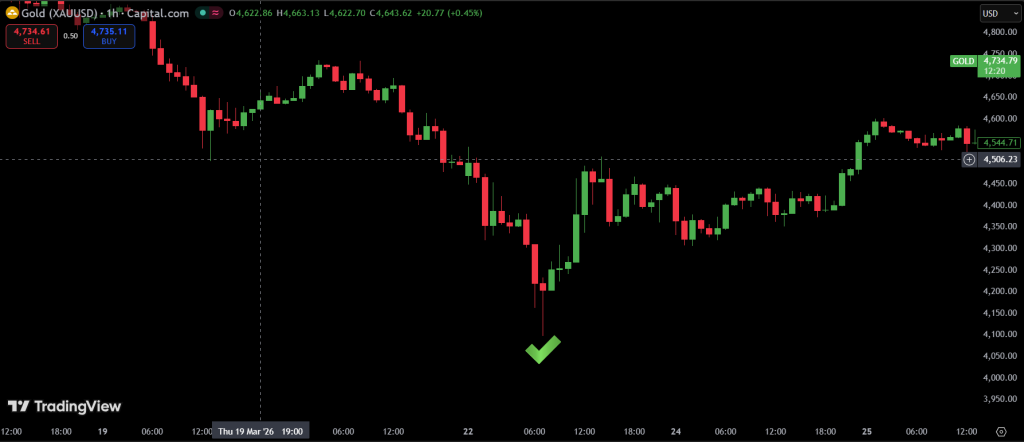
In some cases, the structure works as expected, especially when it appears after a clear decline and is supported by follow-through buying. In other cases, the same pattern fails because there is no real momentum shift behind it.
What Makes a Strong Hammer Setup (Quick Checklist)
Not every setup that looks like a reversal is actually reliable. A valid hammer pattern only becomes meaningful when it appears in the right context and shows real rejection of lower prices, not just a temporary spike.
The strength of a setup is usually confirmed by what happens after it forms. That’s where a hammer confirmation signal becomes important, because without follow-through price action, the pattern often fails.
Here is a simple checklist traders use:
- The market is in a clear downtrend before the candle forms
- The lower wick is long compared to the body
- Price quickly rejects lower levels
- The next candle confirms upward movement (not immediate reversal)
- The setup appears near a meaningful support area
Even if a setup looks clean, it is not enough on its own. Without confirmation, even a valid-looking structure can turn into a weak or failed signal.
False Hammer Patterns and Fake Signals
Not every hammer-looking candle leads to a reversal. In many cases, the market creates a false hammer pattern, where price briefly spikes lower, attracts buyers, and then continues falling. This is one of the most common traps in price action trading.
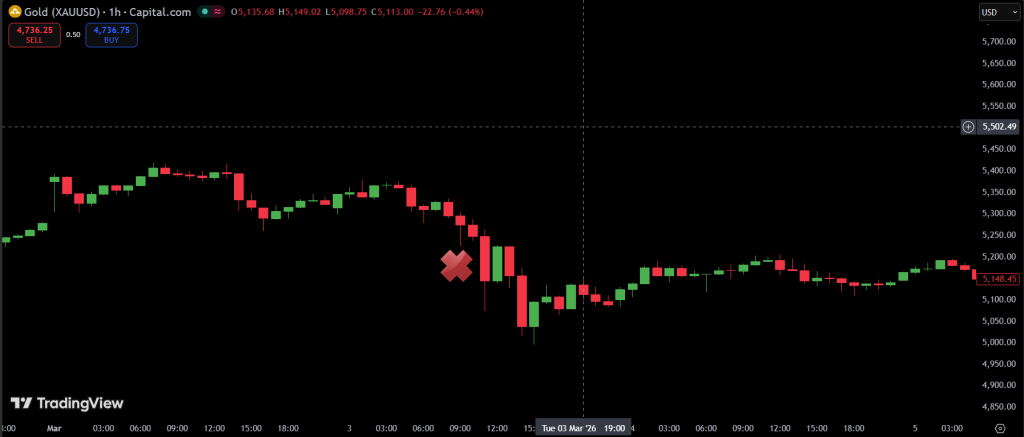
A fake hammer candlestick usually forms during strong momentum moves, when the market is not ready to reverse. It can look clean on the chart, but there is no real buying pressure behind it, so the move fails quickly after entry.
These situations often happen during high volatility or when liquidity is being taken before continuation in the original direction.
Common Situations Where Fake Hammers Appear
A hammer false signal usually shows up when the market is not actually trying to reverse, even if the candle shape suggests otherwise. In these moments, price action is often driven by strong momentum or liquidity grabs, not real buying interest.
One common situation is a fast trending market. Price drops sharply, forms a wick that looks like a hammer, and then continues moving lower. Another typical case is during news spikes, when volatility creates sharp reactions that quickly get reversed.
A false hammer pattern can also appear near weak or untested levels where there is no real support. In these areas, buyers step in too early, but sellers remain in control.
Common Hammer Trading Mistakes
Many losses from hammer setups come not from the pattern itself, but from how it is used. One of the most common issues is treating every candle that looks like a hammer as a strong buy signal, without checking the broader context.
A typical hammer pattern mistake is entering a trade immediately after the candle forms, without waiting for confirmation. In many cases, price briefly reacts but then continues in the original direction, especially in strong trends.
Another frequent issue is ignoring market structure. Traders often focus only on the candle shape and miss whether the market is actually in a reversal zone or just continuing its move. This leads to repeated trading hammer errors, especially in volatile conditions.
How to Avoid Losing Trades on Hammer Signals
The main problem with hammer-style setups is not the pattern itself, but how quickly traders act on it. To avoid common hammer pattern mistakes, it’s important to slow down and let the market confirm what it actually wants to do.
A simple approach is to wait for follow-through price action instead of entering immediately. If the market is truly reversing, it should show clear strength after the setup forms. If it doesn’t, the signal is often weak or invalid.
Many trading hammer errors happen when traders ignore the broader trend. Even a clean-looking setup can fail if it appears inside strong momentum without any real shift in control between buyers and sellers.
Risk control also plays a key role. Tight stop placement based only on the candle itself is often not enough without considering structure and nearby levels.
Hammer Pattern vs False Signals (Quick Comparison)
A real challenge for traders is that both valid setups and false hammer pattern formations can look almost identical on the chart. The difference usually becomes clear only after price starts moving.
The key is not the candle shape itself, but how the market behaves next and whether there is real follow-through behind the move.
Comparison Table
| Feature | Valid Hammer Setup | Fake Hammer Candlestick |
|---|---|---|
| Market context | Appears after clear downtrend | Often appears in strong momentum or noise |
| Price reaction after candle | Strong move upward (confirmation) | Price continues downward or reverses quickly |
| Follow-through | Yes, continuation in reversal direction | No follow-through or immediate failure |
| Market strength | Shows shift in control to buyers | No real buying pressure |
| Trader outcome | Higher probability setup | Common false hammer pattern trap |
FAQ
Why do hammer candlestick patterns fail?
A hammer-style setup can fail when there is no real shift in market pressure. In many cases, what looks like a reversal is actually just a temporary move inside a strong trend. This is where a false hammer pattern often appears and price continues in the original direction.
How can I tell a fake hammer pattern?
A fake hammer candlestick usually fails to produce follow-through. Instead of moving upward after forming, price quickly reverses again and continues in the prior direction. The main warning sign is lack of confirmation after the candle closes.
What is the biggest mistake when trading hammer setups?
One of the most common hammer pattern mistakes is entering immediately after the candle forms without waiting for confirmation. Another issue is ignoring the overall market trend and treating the setup in isolation.
Can hammer patterns be trusted on their own?
No. Even strong-looking setups need confirmation. Without it, they can easily turn into false hammer pattern situations that lead to losing trades.

