This article compares the hammer candlestick pattern with similar formations such as the hanging man, doji, and inverted hammer. The goal is to help you understand how each pattern behaves in different market conditions and how traders distinguish between them in real trading situations. The hammer is usually seen after a downtrend and often signals a possible bullish reversal, while similar-looking candles can have completely different meanings depending on context.
One of the most important comparisons is hammer vs hanging man, where the key difference is not the shape but the market trend before the candle appears. Another useful comparison is hammer vs doji, since both can show uncertainty or reversal signals, but the hammer is more directional and shows stronger rejection of lower prices.
Hammer vs Hanging Man (difference hammer hanging man)
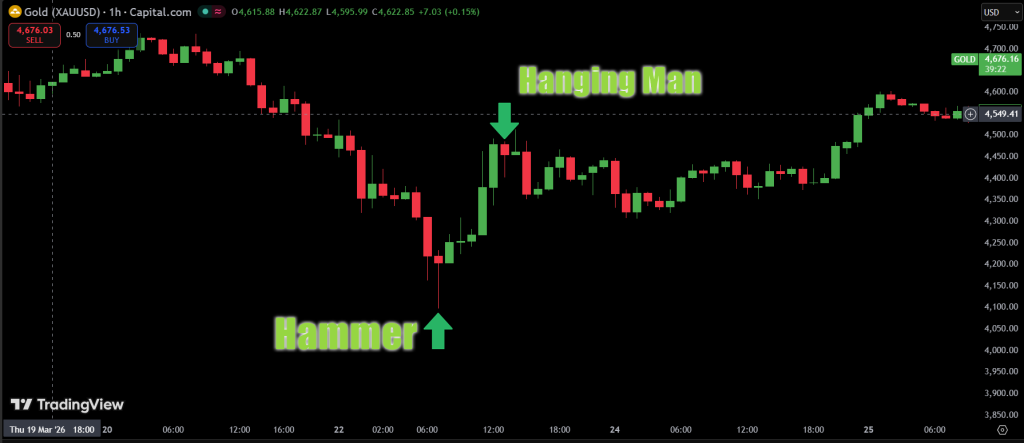
The hammer candlestick pattern and the hanging man look almost identical on the chart, but their meaning depends entirely on where they appear in the trend. The hammer shows up after a downtrend and is often seen as a potential bullish reversal signal, meaning buyers may be starting to take control after a period of selling pressure.
The hanging man appears after an uptrend and can signal that bullish momentum is weakening. Sellers are starting to push the price down, even if buyers briefly recover it. So the key difference hammer hanging man is not the candle shape itself, but the trend context before it appears, the same structure can suggest either reversal or weakness depending on market direction.
Hammer vs Doji (doji vs hammer)
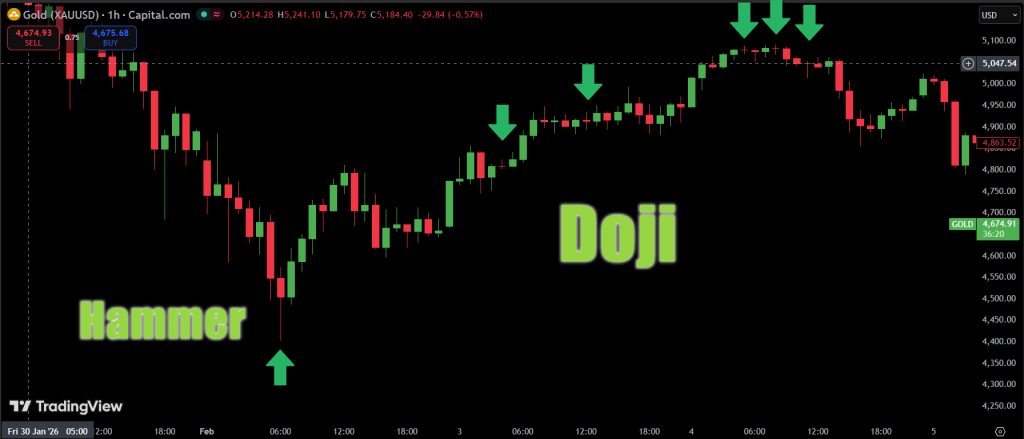
When comparing doji vs hammer, the main difference is how much direction the candle actually shows. A hammer candlestick pattern has a small real body and a long lower wick, which tells us that price was pushed down but buyers strongly rejected lower levels. This often hints at a possible bullish reversal, especially after a downtrend.
A doji candlestick looks different because its opening and closing prices are almost the same. This creates a very small or even invisible body, showing pure market indecision rather than clear buying or selling pressure. While both patterns can appear at potential turning points, a hammer is more directional and suggests a reaction from buyers, while a doji is neutral and usually needs extra confirmation before making any trading decision.
Hammer vs Inverted Hammer (difference inverted hammer)
The inverted hammer candlestick pattern forms after a downtrend, just like the regular hammer, but the structure is flipped. Instead of a long lower wick, it has a long upper wick. This shows that buyers tried to push the price higher, but sellers managed to pull it back down before the candle closed.
The key difference inverted hammer is in the direction of price pressure. A hammer candlestick pattern shows strong buying support after selling pressure, meaning buyers successfully reject lower prices. The inverted hammer, on the other hand, shows early bullish attempts that are not fully confirmed yet and usually need the next bullish candle to validate the signal.
Key Interpretation Rules for Traders
Here’s a simple and practical table to help you quickly understand how each candlestick pattern should be interpreted in real trading:
| Pattern | What it shows | Where it appears | How strong it is alone | What you need for confirmation |
|---|---|---|---|---|
| Hammer | Strong buying after selling pressure | After a downtrend | Medium to strong | Bullish follow-through candle + volume |
| Hanging Man | Early selling pressure in an uptrend | After an uptrend | Weak alone | Bearish confirmation candle |
| Doji | Market indecision (balance of buyers & sellers) | Any trend | Very weak alone | Directional candle after doji |
| Inverted Hammer | Attempted buying pressure that failed to continue | After a downtrend | Weak alone | Strong bullish candle next session |
This table helps you see one important idea: none of these patterns should be used in isolation. Context + confirmation always matter more than the shape itself.
Conclusion
Understanding hammer vs other candlestick patterns helps traders avoid misinterpretation and false signals. The same candle shape can mean completely different things depending on trend context and market structure, so confirmation is always important for making more accurate trading decisions.
FAQ
What is the main difference between hammer and hanging man?
The difference is the trend context: hammer appears in downtrends, hanging man in uptrends.
Is doji stronger than hammer?
No, a hammer is generally more directional, while a doji only shows indecision.
What confirms an inverted hammer?
A strong bullish candle after it confirms potential reversal.
Can hammer and inverted hammer mean the same thing?
No, they differ in wick direction and market psychology.
