The hammer candlestick pattern is a simple but powerful signal used in price action trading. It often appears after a falling market and can show that sellers are losing control while buyers are starting to push the price up again. This is why traders often see it as a possible bullish reversal signal.
The idea behind the hammer pattern meaning is easy to understand: price drops during the session, but then strongly recovers and closes near the top. In this guide, we will explain what is hammer pattern, how to spot it on the chart, and how traders use it in real trading situations.
What Is Hammer Candlestick Pattern?
The hammer pattern is a single candlestick formation that appears after a downtrend and signals a possible change in direction. In simple terms, it shows that the market tried to push the price much lower, but buyers stepped in and pushed it back up by the end of the session.
This is why the hammer candlestick is often seen as a bullish reversal signal. It does not guarantee that the price will rise, but it shows that selling pressure may be weakening and buyers are starting to fight back.
Traders use this pattern to understand potential turning points in the market, especially when it appears near key support levels or after a strong drop.
Hammer Candlestick Structure Explained
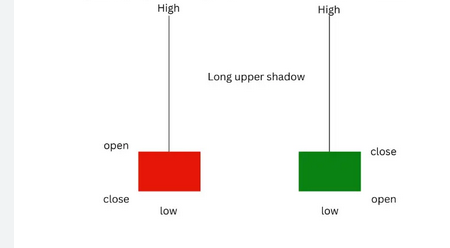
A hammer candlestick pattern has a very simple and clear shape, which is why it is easy to recognize on a chart.
It usually has a small body near the top of the candle and a long lower shadow. This long lower wick shows that the price dropped strongly during the session, but then buyers pushed it back up before the close. The upper wick is either very small or does not exist at all.
For a candle to be considered a valid hammer pattern, it should appear after a clear downtrend. Without this context, the same shape can lose its meaning and give a false signal.
How to Identify Hammer Candlestick Pattern
To correctly spot a hammer candlestick pattern, you need to look at both the shape of the candle and the market context.
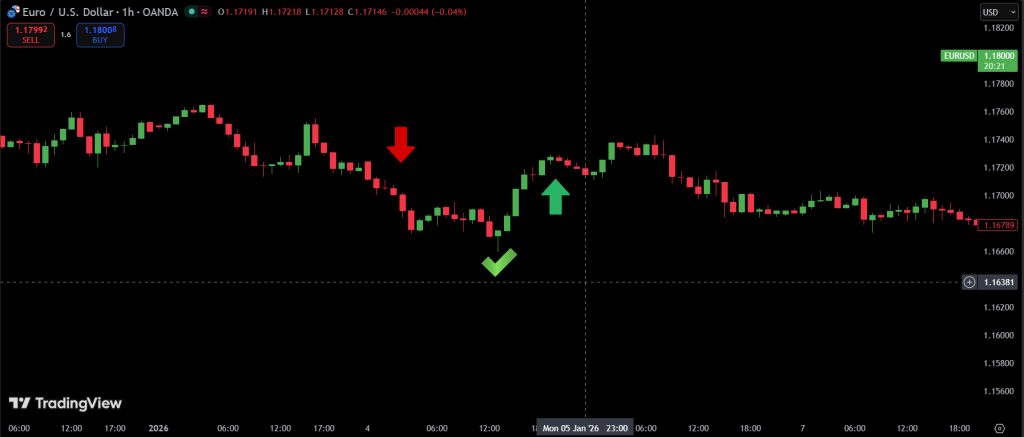
First, the market should be in a clear downtrend. Then you look for a candle with a small body near the top and a long lower shadow. This shows that price was pushed down during the session but recovered strongly before closing.
Another important step is location. A real hammer pattern is much more reliable when it forms near a support level or after a strong drop. Without this, the signal can be weak or misleading.
Finally, traders often wait for confirmation. This means the next candle should close higher to increase the chance that a real reversal is starting.
Hammer Pattern Psychology (Market Behavior)
The hammer candlestick pattern is not just a shape on the chart — it shows real behavior between buyers and sellers.
During the candle, sellers first take control and push the price lower. But then buyers step in with strong demand and push the price back up. By the end of the session, the market closes near the top, showing that selling pressure was rejected.
This is why the hammer pattern meaning is often connected to a possible shift in momentum. It suggests that sellers are losing strength, while buyers are becoming more active. However, this does not guarantee a reversal, it only shows that the balance in the market may be changing.
How to Trade Hammer Candlestick Pattern
The hammer candlestick pattern can be used as a simple entry signal, but only when you follow clear rules.
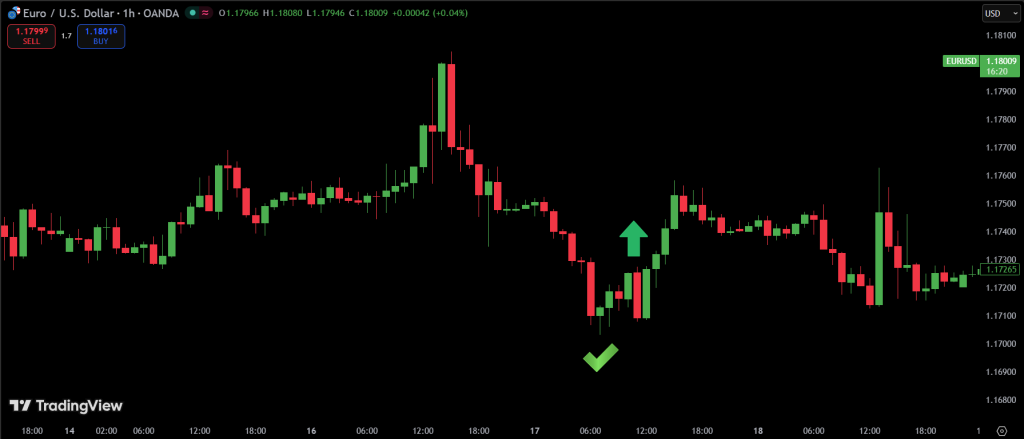
Most traders do not enter immediately after seeing the hammer. They wait for a confirmation candle that closes higher. This helps reduce false signals and increases the chance that a real reversal is starting.
A common entry method is to enter a buy trade after confirmation. The stop loss is usually placed below the lowest point of the hammer wick. This protects the trade if the market continues to move down.
For take profit, traders often target the nearest resistance level or previous market highs. This keeps the strategy simple and based on market structure.
Best Confirmation Signals for Hammer Pattern
The hammer candlestick pattern becomes much stronger when it is supported by other signals from the market.
- One of the most common confirmations is support levels. If the hammer forms near a strong support zone, it increases the chance of a real reversal.
- Another useful tool is RSI. When RSI shows oversold conditions, it can support the idea that selling pressure is already exhausted.
- Traders also look at volume. A hammer with higher volume suggests stronger buyer interest.
- Some traders use moving averages like SMA50 to confirm the overall trend direction and avoid taking signals against strong momentum.
Hammer Pattern vs Other Candlestick Patterns
The hammer candlestick pattern is often confused with similar-looking candles, but the key difference is always the market context. A hammer appears after a downtrend and signals a possible bullish reversal, while other patterns may look similar but tell a completely different story.
To avoid mistakes, it is important to compare their structure and meaning clearly.
Comparison Table
| Pattern | Where it appears | Meaning | Direction | Key difference |
|---|---|---|---|---|
| Hammer | After downtrend | Possible bullish reversal | Bullish | Long lower wick, rejection of lower prices |
| Inverted Hammer | After downtrend | Weak bullish signal, needs confirmation | Bullish (uncertain) | Long upper wick, weaker buyer control |
| Shooting Star | After uptrend | Bearish reversal signal | Bearish | Long upper wick, rejection of higher prices |
Common Mistakes When Trading Hammer Pattern
The hammer candlestick pattern looks simple, but many traders still use it incorrectly. The main problem is that they treat it as a strong buy signal without waiting for confirmation or checking the market context.
Another issue is that traders often forget that a single candle does not control the market. The hammer only shows rejection of lower prices, not a guaranteed reversal.
Common Mistakes
- Entering trades without confirmation candle. Many traders open a buy position immediately after seeing a hammer. Without confirmation, this can lead to false signals and quick losses.
- Using hammer pattern in sideways markets. In a range market, price moves up and down without clear direction, so the hammer becomes less reliable and often fails.
- Ignoring overall trend direction. A hammer works best after a strong downtrend. If the trend is unclear, the pattern loses its meaning.
- Placing incorrect or no stop loss. Some traders do not place a stop loss below the hammer low, which increases risk if the market continues to fall.
- Relying only on the hammer pattern. Using the pattern alone without support, volume, or other signals reduces accuracy and leads to weak trades.
- Trading without support or resistance levels. A hammer near key support is much stronger. Ignoring these levels makes entries less precise and riskier.
Hammer Pattern in Forex, Stocks and Crypto
The hammer candlestick pattern can be used across different markets, but its behavior is not exactly the same everywhere. Understanding these differences helps traders avoid false expectations and adjust their strategy.
In forex trading, the hammer is often more reliable because the market is highly liquid and reacts smoothly to support and resistance levels. In stocks, the pattern can be slower but more structured, especially on higher timeframes. In crypto markets, the hammer appears more frequently, but it also produces more false signals due to high volatility.
This is why traders should always adapt the use of the hammer pattern meaning depending on the market they are trading in.
Key Differences by Market
- Forex. Works best in liquid sessions and responds well to technical levels. Hammer signals are often cleaner and more consistent.
- Stocks. More stable price movement, but signals may take longer to develop. Higher timeframes are more reliable.
- Crypto. Very fast price movements and high volatility. Hammer patterns appear often but require strong confirmation before entry.
Advanced Hammer Trading Strategy
The hammer candlestick pattern becomes much more powerful when it is used as part of a complete trading system instead of a single signal. Advanced traders do not rely on the pattern alone. They look for confluence between structure, trend, and confirmation signals.
One of the most effective approaches is to combine the hammer with a clear downtrend, a strong support zone, and a confirmation candle. This creates a higher probability setup compared to trading the pattern in isolation.
Confluence-based approach
- Market is in a clear downtrend
- Price reaches a support or demand zone
- A hammer candlestick forms with a long lower wick
- Next candle confirms bullish momentum
When all these conditions align, the hammer pattern meaning becomes much stronger and can indicate a high quality reversal opportunity.
Hammer Entry Point
The hammer entry point is not just about spotting the candle. A hammer becomes tradable only when the market shows signs that buyers are actually stepping in.
There are several ways to enter a trade:
- After the candle closes. This is an aggressive approach. It works when the market shows a strong bounce from support and immediate buying pressure.
- After a breakout of the high. This is the safest and most common hammer entry point. When price breaks above the hammer’s high, it confirms that buyers are in control.
- On a retest. Sometimes price pulls back after the hammer forms. Entering on a small pullback can improve your risk-to-reward ratio.
In most cases, waiting for a breakout gives a cleaner and more reliable signal.
Hammer Stop Loss
A proper hammer stop loss helps protect your trade while giving the market enough space to move.
The most common placements are:
- Below the lower shadow. This is the standard hammer stop loss. If price breaks below the wick, the setup is no longer valid.
- Below the low with a small buffer. Adding a small distance below the wick helps avoid getting stopped out by market noise.
- Below a support level. If the hammer forms at support, placing the stop slightly below that level can be more reliable.
In simple terms, if the market goes below the hammer’s low, the idea behind the trade is wrong.
Hammer Take Profit
Planning the hammer take profit in advance is just as important as finding the entry.
Here are the most common ways to exit a trade:
- At the nearest resistance level. This is the most logical hammer take profit, as price often reacts there.
- Using a risk-to-reward ratio. Many traders aim for at least 1:2 or 1:3. For example, risking 50 points to make 100 or more.
- Partial profit taking. You can close part of your position early and let the rest run if the trend continues.
A balanced approach is to combine resistance levels with a solid risk-to-reward ratio.
Hammer Pattern Confirmation
Hammer pattern confirmation is what separates strong signals from weak ones. Without confirmation, the pattern can easily fail.
Key signs to look for:
- the next candle closes higher
- price shows strong upward movement
- volume increases
- the pattern forms at support
- indicators support the move
Proper confirmation for hammer pattern increases the probability of success. The best setups show a clear move upward right after the hammer forms.
Hammer at Support and Resistance
The location of the pattern plays a major role. The concept of hammer support resistance is essential for understanding when the pattern works best.
Hammer at Support
A hammer at support is one of the strongest signals:
- it appears after a decline
- it shows rejection of lower prices
- it suggests that buyers are stepping in
This setup often leads to a reversal or at least a short-term bounce.
Hammer at Resistance
A hammer at resistance is often misunderstood. Even though the candle looks like a hammer, its meaning changes depending on where it appears.
When this pattern forms at the top of an uptrend or near a resistance level, it is no longer treated as a bullish signal. In this context, it is known as a hanging man.
This is where many traders make mistakes. They see a hammer shape and expect the price to go up, but location is more important than the shape itself.
Key points to understand:
- the same candle shape can have different meanings
- at resistance, a hammer becomes a hanging man
- it signals potential weakness, not strength
- it often appears before a reversal or pullback
A hammer at resistance or hammer support resistance setup should always be analyzed carefully. If the pattern appears after an uptrend and near a key level, it is more accurate to treat it as a bearish warning rather than a buying opportunity.
In simple terms, a hammer at the bottom suggests buying, while the same candle at the top, as a hanging man, warns that the market may go down.
Conclusion
The hammer candlestick pattern is a simple but useful tool for spotting possible market reversals after a downtrend. It shows that selling pressure may be weakening and buyers are starting to take control.
However, the real strength of the hammer pattern meaning comes from context and confirmation. When it is combined with support levels, trend analysis, and confirmation candles, it becomes a much more reliable part of a price action trading strategy.
Used correctly, the hammer can help traders find better entry points, but it should never be used alone without proper risk management.
FAQ
What does hammer candlestick mean?
The hammer candlestick pattern is a bullish reversal signal that appears after a downtrend. It shows that buyers are starting to push the price up after strong selling pressure.
Is hammer pattern reliable?
The hammer pattern is more reliable when it appears after a strong downtrend and is confirmed by the next candle, volume, or support levels. Without confirmation, it can give false signals.
Can hammer candlestick fail?
Yes, the hammer can fail, especially in sideways markets or when there is no confirmation. That is why risk management is always important.
What timeframe is best for hammer pattern?
Higher timeframes like H1, H4, and Daily are usually more reliable because they reduce market noise and false signals.
Should I use hammer pattern alone?
No, it is better to combine the hammer candlestick pattern with other tools like support and resistance, trend analysis, or indicators for better accuracy.

