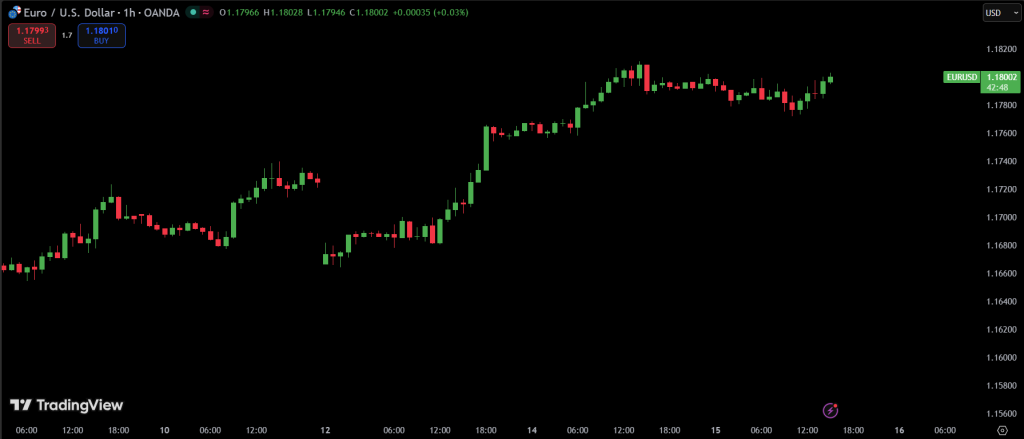
Japanese candlesticks are one of the easiest ways to understand what’s happening in the market. If you’ve ever opened a trading chart, you’ve probably seen these colored candles moving up and down.
So, what are candlestick charts? They are a simple way to show how price changes over time. Each candle tells a short story about what happened during a specific period. It shows where the price started, where it moved, and where it ended.
This is why many traders prefer them. With just a quick look, you can understand who is stronger in the market. That’s exactly what candlestick trading explained is all about. It makes price action clear and easy to read.
In this guide, you’ll learn how these candles work and how to use them in your trading step by step.
What Are Japanese Candlesticks?
Japanese candlesticks are a way to display price movements on a chart using candle-shaped elements. Each candle shows four key prices for a specific period: open, high, low, and close.
So, what are candlestick charts? They are charts built from these candles, where each one represents how the price moved during a selected timeframe, such as 1 minute, 1 hour, or 1 day.
In simple terms, candlestick chart explained means understanding how each candle reflects market activity. One candle gives a quick and clear summary of what happened with price during that period.
The japanese candles meaning comes from how traders read them. By looking at the size and shape of a candle, you can quickly see whether buyers or sellers were in control.
How Candlestick Charts Work
To understand how candlesticks work, you need to look at what each candle actually shows. Every candle represents a specific time period and is built from four price points: open, high, low, and close.
Each candle tells a simple story. If the price closes higher than it opened, the candle is usually green or white. If it closes lower, it is red or black. This is what people often mean by candle chart forex, because forex traders use these candles to track price movement very clearly.
The body of the candle shows the distance between the open and close. The thin lines above and below, called wicks, show the highest and lowest price during that period. This structure helps traders quickly understand market pressure without needing complex calculations.
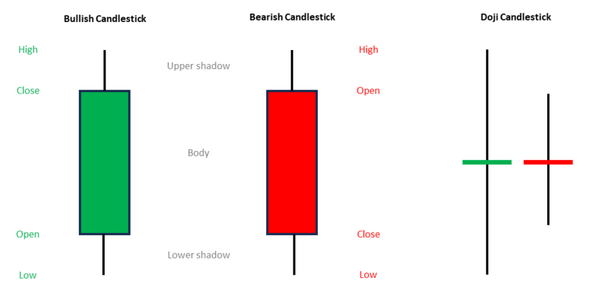
Candlestick Anatomy (Structure of a Candle)
To fully understand trading charts, you need to know how each candle is built. This is called candlestick anatomy, and it is the foundation of reading price action.
Each candle has three main parts. The body shows the distance between the opening and closing price. The wick (or shadow) shows the highest and lowest price reached during the period. Together, these parts give a complete picture of market movement.
When you understand how candlesticks work, it becomes much easier to read the chart. A long body usually means strong momentum, while long wicks can show rejection of price levels.
Bullish vs Bearish Candles
A very important part of reading charts is understanding the difference between buyers and sellers. This is shown through bullish and bearish candles.
- A bullish candle appears when the closing price is higher than the opening price. It usually shows that buyers were stronger during that period and pushed the price up.
- A bearish candle is the opposite. It forms when the closing price is lower than the opening price, meaning sellers had more control and pushed the price down.
The idea behind japanese candles meaning is simple. Each candle reflects who was stronger in the market at that moment, buyers or sellers.
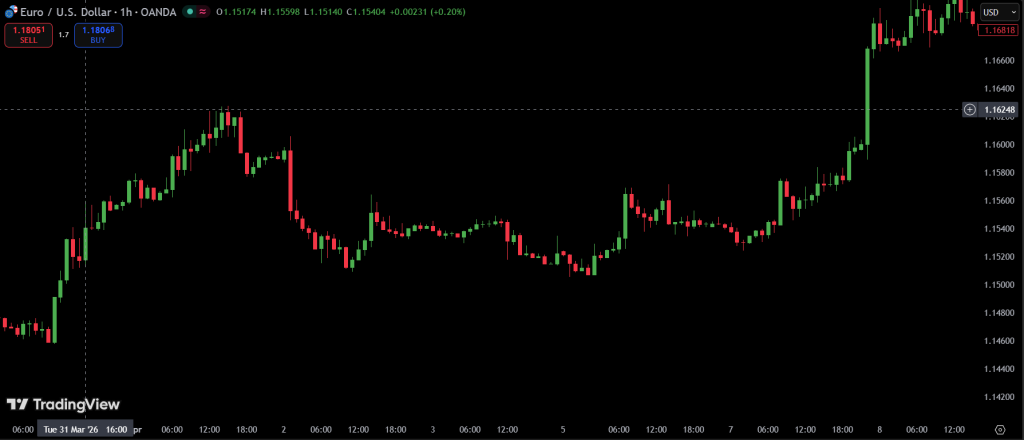
How to Read Candlestick Charts
Learning how to read candlestick charts is not about memorizing patterns, but about understanding what price is telling you in real time.
Start by looking at the direction of the candles. If most candles are moving up, buyers are in control. If they are moving down, sellers are stronger. Then pay attention to the size of each candle. Large candles usually show strong momentum, while small candles often show indecision.
This is the core idea of candlestick analysis for beginners. You are not predicting the market from one candle. Instead, you are reading the overall behavior of price and how it reacts at different levels.
With practice, you will start to see how candles form trends, pauses, and possible reversals.
Basic Candlestick Patterns You Should Know
Candlestick patterns are simple formations that appear on the chart and can help traders understand possible market behavior. They do not guarantee outcomes, but they often show where momentum might change or continue.
Below are the most important basic patterns every trader should know. These are widely used in forex candlestick patterns and are often treated as early candlestick signals for market direction.
Main Candlestick Patterns
| Pattern | Type | What it Means |
|---|---|---|
| Hammer | Reversal (Bullish) | May signal a potential upward reversal after a downtrend |
| Inverted Hammer | Reversal (Bullish) | Suggests buying pressure after selling decline |
| Shooting Star | Reversal (Bearish) | May indicate a possible downward reversal after an uptrend |
| Hanging Man | Reversal (Bearish) | Shows weakness after an upward move |
| Bullish Engulfing | Reversal (Bullish) | Strong buying pressure fully covers previous bearish candle |
| Bearish Engulfing | Reversal (Bearish) | Strong selling pressure fully covers previous bullish candle |
| Doji | Indecision | Market uncertainty between buyers and sellers |
| Morning Star | Reversal (Bullish) | Potential bullish reversal after downtrend |
| Evening Star | Reversal (Bearish) | Potential bearish reversal after uptrend |
Candlestick Charts vs Bar Charts
Traders often compare different chart types, but the most common question is the difference between candlestick and bar charts.
A candlestick chart is easier to read because it clearly shows bullish or bearish movement using colored bodies. Each candle gives a quick visual idea of market direction and strength.
A bar chart shows the same price data, but in a less visual way. It uses simple vertical lines and small marks for open and close, which can be harder to interpret at first glance.
This is why many traders prefer candlesticks when working with candlestick vs bar chart comparisons. They simply make price action more readable and intuitive, especially for beginners.
Why Traders Use Candlestick Charts
Traders use candlestick charts because they make price movement easy to understand without needing complex tools. Each candle quickly shows who was in control during a specific period, buyers or sellers.
Another reason is that candlesticks help spot momentum and possible reversals. When traders see strong movement or repeated patterns, it can give clues about future price behavior.
This is why many people search for candlestick trading explained. They want a simple way to read the market and make better decisions. Candlesticks also create clear candlestick signals that can be combined with other tools for confirmation.
Common Mistakes When Using Candlesticks
Many beginners misunderstand how candlesticks should be used and end up making simple mistakes that hurt their trading decisions. The problem is usually not the candles themselves, but how they are interpreted without enough context.
Below are the most common mistakes traders make when using candlestick charts:
- Trading a single candle without market context
- Ignoring the overall trend and structure
- Relying only on patterns without confirmation
- Entering trades too early based on weak signals
- Misreading long wicks as strong reversals every time
- Overusing candlestick signals without other tools
- Not waiting for candle close before making a decision
Understanding these mistakes is an important part of candlestick analysis for beginners, because it helps you avoid false signals and improve decision making.
Summary: How Candlesticks Work in Trading
Japanese candlesticks are a simple way to understand price movement in trading. Each candle shows how price changed during a specific time period, including where it opened, closed, and how high or low it went.
By learning how candlesticks work, you can quickly see whether buyers or sellers are in control. This helps you read the market more clearly without relying on complex tools.
Candlestick charts also become more powerful when you understand patterns and market context. Over time, they help you spot trends, reversals, and important price reactions.
The main idea is simple. Candlesticks do not predict the market, but they help you read it better.
FAQ
What are candlestick charts?
Candlestick charts are a way of showing price movement using candles. Each candle displays open, high, low, and close prices for a specific time period, making it easier to understand market behavior at a glance.
How do candlesticks work in trading?
Candlesticks work by visually showing how price moves within a selected timeframe. They help traders see whether buyers or sellers were stronger during that period.
What is a bullish and bearish candle?
A bullish candle means the price closed higher than it opened, showing buying pressure. A bearish candle means the price closed lower, showing selling pressure.
How do you read candlestick charts?
To read candlestick charts, traders look at the body, wicks, and overall direction of candles to understand trend strength and possible market reactions.
Are candlestick patterns reliable?
Candlestick patterns can be helpful, but they are not always reliable on their own. They work best when combined with trend analysis and confirmation tools.
What is the difference between candlestick and bar charts?
Candlestick charts are more visual and easier to read, while bar charts show the same data in a less intuitive format.

