
If you’re new to financial markets, you’ve likely encountered terms like trading indicators, forex indicators, or technical analysis. But what are trading indicators exactly? They are not magical tools that predict the future. Instead, they are mathematical calculations based on price, volume, and time that help traders analyze market conditions and make informed decisions.
To truly grasp what are indicators in trading, it helps to start with the trading indicators meaning: they are visual tools displayed on price charts that transform raw market data into actionable insights. Whether you’re exploring what are forex indicators or diving into what are indicators in forex trading, the core concept remains the same, these tools help cut through market noise and provide clarity.
For those seeking understanding trading indicators, the journey begins with technical analysis basics. While some traders debate price action vs indicators, the reality is that both approaches have their place. A solid trading education for beginners includes learning how indicators complement market analysis and how to use them effectively on any trading platform.
In this guide, we’ll answer what are indicators in trading, explain how they work, explore the forex indicators meaning alongside general trading indicators meaning, and give you a solid foundation to start using them effectively. Whether you’re focused on forex indicators or broader markets, understanding trading indicators is your first step toward making more informed trading decisions.
What Are Trading Indicators? A Simple Definition
At its core, what are indicators in trading can be answered with a straightforward definition: trading indicators are mathematical calculations based on price data, volume, or open interest that are displayed visually on trading charts to help traders identify patterns, trends, and potential trading opportunities.
To understand the trading indicators meaning, imagine you’re looking at a raw price chart with hundreds of candlesticks. Without any tools, it can be overwhelming to spot meaningful patterns. Trading indicators simplify this by applying mathematical formulas to the price data and presenting the results as lines, histograms, or colored zones. This visual representation makes it easier to interpret market conditions at a glance.
Similarly, when exploring what are forex indicators, the concept is identical, these are the same mathematical tools applied specifically to the foreign exchange market. The forex indicators meaning is no different from general trading indicators meaning: they are decision-making tools that help traders analyze currency pairs and make informed entry and exit decisions.
Whether you’re looking at what are indicators in forex trading or broader financial markets, the purpose remains consistent. All trading indicators explained in simple terms are just tools that take raw data and transform it into something more digestible. Forex indicators explained follow the same logic, they help cut through noise, confirm trends, identify momentum shifts, and signal potential reversals.
The key to understanding trading indicators is recognizing that they don’t predict the future. Instead, they provide a structured way to interpret what price has already done and help you make probabilistic decisions based on historical patterns. This foundational knowledge is essential before diving into specific indicators or strategies.
How Do Trading Indicators Work?
Understanding how do trading indicators work requires looking under the hood at their basic mechanics. At their core, indicators are algorithms that process historical data, typically price and volume, through mathematical calculations to produce a value that is then plotted on a chart.
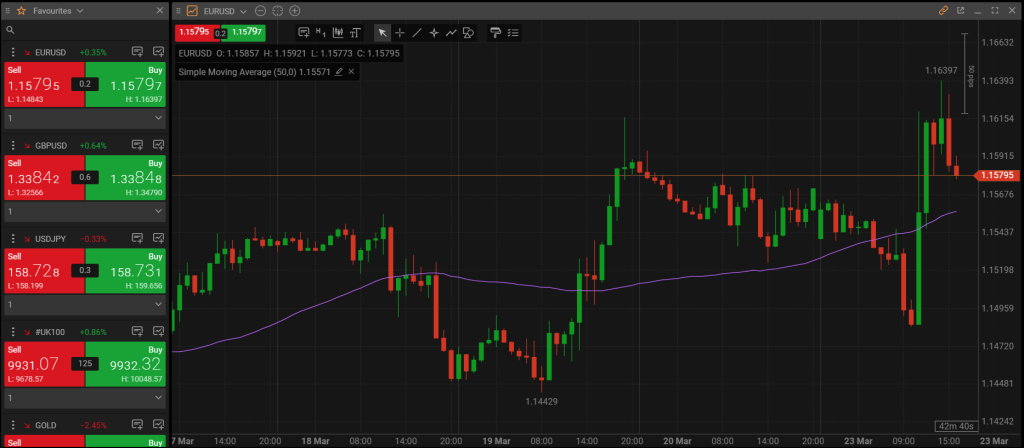
Most trading indicators follow a similar workflow: they take raw price inputs (such as closing prices over a specified period), apply a formula, and generate a visual output. For example, a simple moving average calculates the average closing price over the last 20 periods and plots it as a continuous line. When the price crosses above or below this line, it generates a potential signal generation event.
The process of how do forex indicators work is identical in concept but applied to currency pairs. A forex trader using the RSI indicator, for instance, is relying on the same mathematical formula as a stock trader, the only difference is the underlying asset.
How Indicators Generate Signals: A Practical Breakdown
Indicators typically generate signals through one of the following mechanisms:
- Crossovers. When a moving average line crosses above or below price (or when two moving averages cross each other), it may signal a trend change.
- Overbought / Oversold Levels. Oscillators like RSI or Stochastic identify when an asset is potentially overextended, suggesting a possible reversal.
- Divergence. When price makes a higher high but the indicator makes a lower high, it can signal weakening momentum and a potential reversal.
- Breakouts from Bands. When price touches or breaks outside Bollinger Bands, it may indicate increased volatility or an impending reversal.
- Centerline Cross. When an indicator like MACD crosses above or below its zero line, it can signal a shift from bearish to bullish momentum (or vice versa).
This leads to an important distinction in all trading indicators explained: indicators fall into two broad categories, lagging vs leading. Lagging indicators (like moving averages) follow price action and confirm trends after they’ve started. Leading indicators (like the Stochastic Oscillator) attempt to predict future price movements by identifying overbought or oversold conditions.
For traders seeking a trading indicators guide, understanding this lagging vs leading concept is crucial. Common trading indicators like MACD and Bollinger Bands are lagging by nature, while RSI and Stochastic are considered leading. Neither is inherently better, they serve different purposes in real-time interpretation of market conditions.
The key takeaway in any forex indicators guide is that indicators are not crystal balls. They don’t predict with certainty; instead, they provide probabilities based on historical data. A real-time interpretation of what the indicator is showing, combined with price action and market context, forms the foundation of effective indicator usage.
Types of Trading Indicators
To build a solid foundation in technical analysis, it is essential to understand the types of trading indicators available. Each category serves a distinct purpose and provides different insights into market behavior. The four main categories are trend indicators, momentum indicators, volatility indicators, and volume indicators.
The Four Main Categories of Trading Indicators
Trend Indicators help traders determine the direction of the market. They smooth out price fluctuations to show whether the market is moving up, down, or sideways. Common examples include Moving Averages, MACD, and ADX.

Momentum Indicators measure the speed at which price is changing. They help identify when a trend is gaining strength or losing momentum. Common examples include RSI, Stochastic Oscillator, and CCI.

Volatility Indicators show the degree of price fluctuation. They help traders set stop loss levels and identify potential breakout opportunities. Common examples include Bollinger Bands and Average True Range (ATR).
Volume Indicators analyze the number of shares or contracts traded. They confirm whether price movements are supported by actual trading activity. Common examples include On Balance Volume (OBV) and Money Flow Index (MFI).
Indicator Categories at a Glance
| Category | Purpose | Common Examples | Best Used For |
|---|---|---|---|
| Trend Indicators | Identify market direction | Moving Averages, MACD, ADX, Ichimoku Cloud | Following established trends, avoiding counter trend trades |
| Momentum Indicators | Measure speed of price change | RSI, Stochastic, CCI, Williams %R | Spotting overbought or oversold conditions, detecting divergence |
| Volatility Indicators | Measure price fluctuations | Bollinger Bands, ATR, Keltner Channels | Setting stop losses, identifying breakout opportunities |
| Volume Indicators | Analyze trading activity | OBV, MFI, Accumulation/Distribution | Confirming trend strength, spo |
Complete List of Trading Indicators
With hundreds of indicators available across different trading platforms, having a list of trading indicators at your disposal helps you understand what tools exist and which ones might suit your trading style. Below is a curated list of all trading indicators organized by category, covering the most widely used tools in both general trading and forex markets.
Complete List by Category
Trend Indicators
- Simple Moving Average (SMA)
- Exponential Moving Average (EMA)
- Moving Average Convergence Divergence (MACD)
- Average Directional Index (ADX)
- Ichimoku Cloud
- Parabolic SAR
- Moving Average Ribbon
Momentum Indicators
- Relative Strength Index (RSI)
- Stochastic Oscillator
- Commodity Channel Index (CCI)
- Williams %R
- Money Flow Index (MFI)
- Awesome Oscillator
- Rate of Change (ROC)
Volatility Indicators
- Bollinger Bands
- Average True Range (ATR)
- Keltner Channels
- Donchian Channels
- Volatility Stop
Volume Indicators
- On Balance Volume (OBV)
- Accumulation Distribution Line
- Volume Weighted Average Price (VWAP)
- Chaikin Money Flow
- Volume Profile
Most Popular Indicators by Market
| Market | Most Popular Indicators | Why They Are Used |
|---|---|---|
| Forex | Moving Averages, RSI, MACD, Bollinger Bands, Ichimoku Cloud | Currency pairs trend strongly; trend and momentum indicators help capture moves |
| Stocks | RSI, MACD, Volume Indicators, VWAP, Bollinger Bands | Volume confirmation is critical; VWAP helps with institutional order flow |
| Crypto | RSI, Moving Averages, MACD, ATR, Fibonacci | High volatility requires volatility indicators; momentum tools help spot reversals |
| Options | RSI, Bollinger Bands, Volume Indicators, Implied Volatility | Volatility is key; RSI helps identify overextended moves for premium selling |
| Futures | ADX, ATR, Volume Profile, Moving Averages | ADX measures trend strength; ATR helps with position sizing and stops |
For traders seeking a complete list of forex indicators, many of the same tools apply. A forex indicators list typically includes Moving Averages, RSI, MACD, Bollinger Bands, and Ichimoku Cloud as the core set. Resources like all forex indicators pdf and all trading indicators explained guides can provide deeper dives into each tool.
Trading Indicators vs. Price Action: Do You Really Need Indicators?
A common debate in the trading world centers around whether traders should rely on trading indicators or focus solely on price action. Both approaches have passionate advocates, and understanding the strengths and weaknesses of each can help you decide what works best for your trading style.
Price action trading involves making decisions based purely on raw price movements displayed on candlestick or bar charts. Practitioners of this approach study candlestick patterns, support and resistance levels, market structure, and trendlines without any additional tools cluttering their charts.
Indicator-based trading relies on mathematical calculations derived from price and volume data. These tools help filter market noise, provide objective entry and exit signals, and can confirm what price action is suggesting.
The reality is that many successful traders use a hybrid approach, combining the clarity of price action with the confirmation power of one or two carefully selected indicators.
Price Action vs. Indicators Comparison
The question “Do you really need indicators?” does not have a universal answer. Some professional traders use no indicators at all, relying purely on price action vs indicators philosophy. Others use a combination of two or three indicators to confirm their analysis. What matters most is consistency, risk management, and finding an approach that suits your personality and trading goals.
For beginners, starting with one or two common trading indicators while also learning basic price action concepts often provides the best foundation. As experience grows, many traders gradually reduce their reliance on indicators and incorporate more price action techniques.
How to Read Trading Indicators
Learning how to read trading indicators is an essential skill that transforms raw data into actionable trading insights. While each indicator has its unique characteristics, most follow common principles that make them interpretable once you understand the basics.
The Three Elements of Reading Indicators
Every indicator provides three layers of information: the value, the visual representation, and the relationship with price. Mastering these three elements allows you to quickly assess what any indicator is telling you.
The Value refers to the actual numerical output of the indicator. For example, RSI produces a value between 0 and 100. A reading above 70 typically indicates overbought conditions, while a reading below 30 suggests oversold conditions. Understanding what these numbers mean in context is the first step.
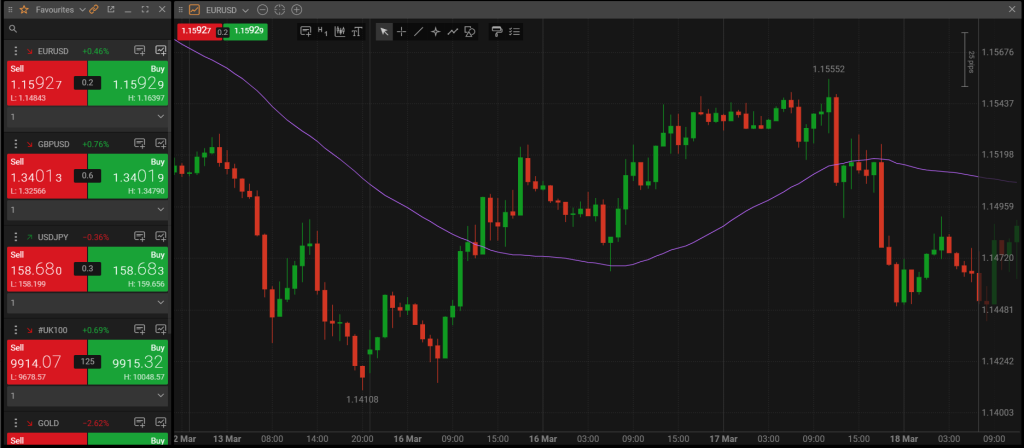
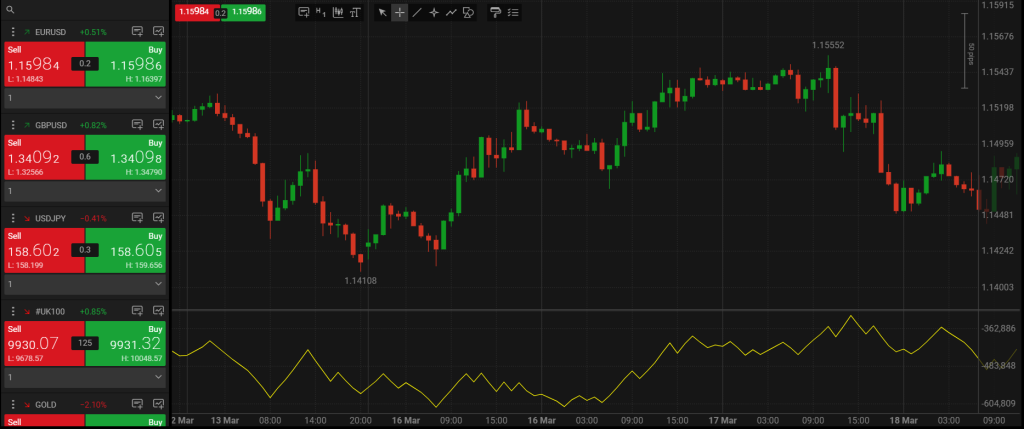
The Visual Representation is how the indicator appears on your chart. Some indicators appear as lines overlaid directly on price, like moving averages. Others appear in a separate window below the price chart, like RSI or MACD. The visual shape, slope, and position all carry meaning. A moving average sloping upward suggests an uptrend. An RSI line rising from oversold territory suggests building momentum.
The Relationship with Price is often the most valuable insight. Indicators become most powerful when you analyze how they interact with price. This includes crossovers, where a moving average crosses above or below price or another moving average. It includes divergence, where price makes a higher high but the indicator makes a lower high, signaling weakening momentum. It also includes support and resistance levels on indicators themselves, where an indicator may bounce from a specific level multiple times.
Common Signal Types Explained
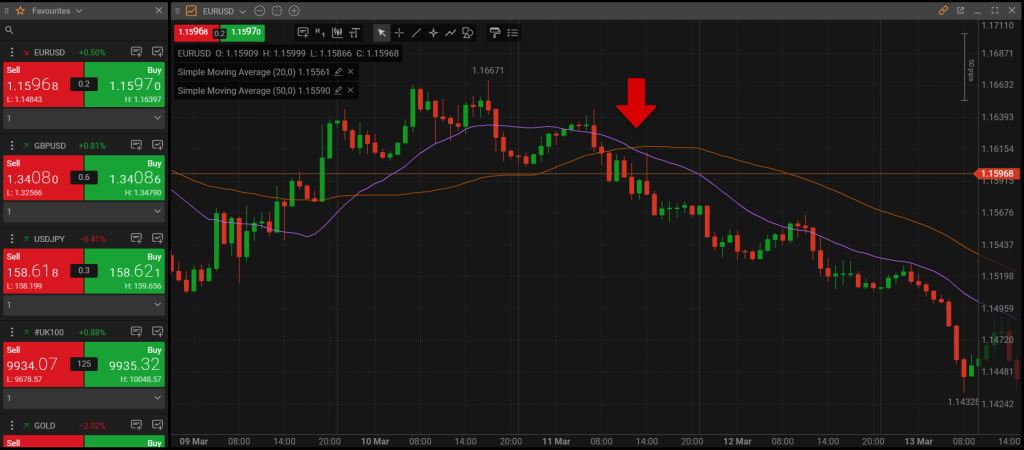
Crossovers occur when one line crosses another. Moving average crossovers are among the most widely used signals. When a shorter term moving average crosses above a longer term moving average, it may signal the start of an uptrend. The opposite crossover may signal a downtrend.
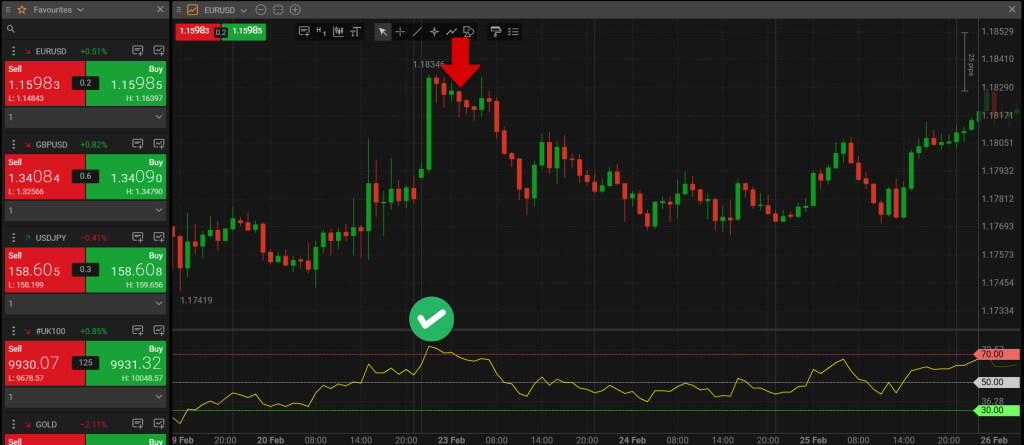
Overbought and oversold signals come from oscillators like RSI and Stochastic. When these indicators reach extreme levels, they suggest that price has moved too far too fast and may be due for a pullback or reversal. However, in strong trends, indicators can remain overbought or oversold for extended periods.
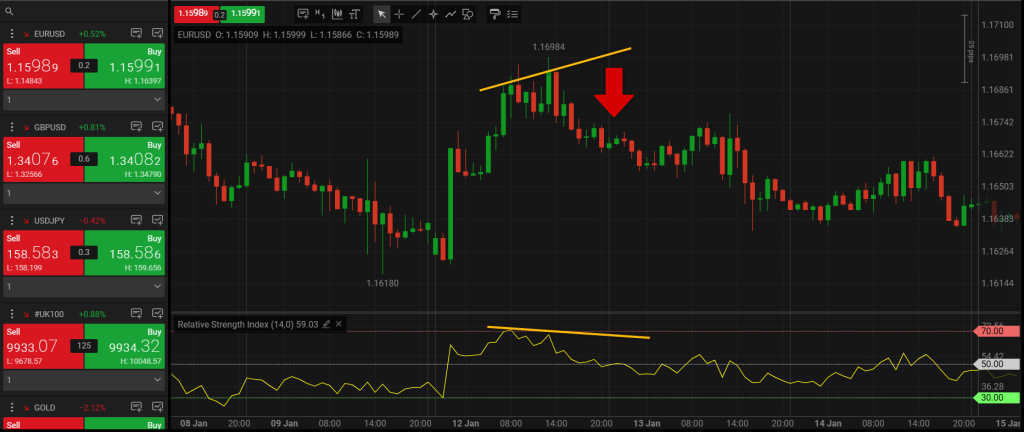
Divergence occurs when price and indicator move in opposite directions. Bullish divergence happens when price makes a lower low but the indicator makes a higher low, suggesting selling pressure is weakening. Bearish divergence occurs when price makes a higher high but the indicator makes a lower high, suggesting buying pressure is fading. Divergence is often considered one of the most reliable signal types.
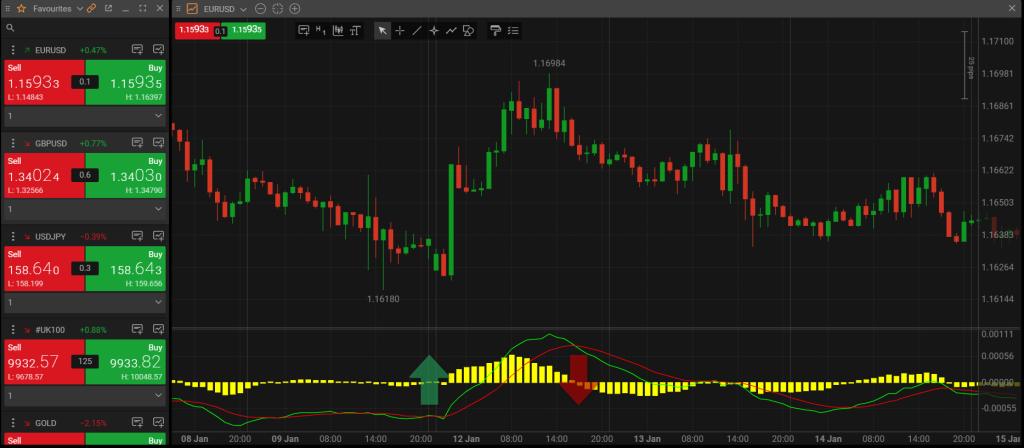
Centerline Crosses apply to indicators like MACD that have a zero line. When MACD crosses above zero, it may signal a shift to bullish momentum. When it crosses below zero, it may signal a shift to bearish momentum. These signals are often used to confirm trend direction.
Practical Tips for Reading Indicators
Start with one or two indicators rather than cluttering your chart with multiple tools. Observe how they behave in different market conditions. A trending market will produce different indicator patterns than a ranging market. Take screenshots of interesting setups and review them later. The more you practice reading indicators in real time, the more intuitive interpretation becomes.
A trading indicators cheat sheet or trading indicators cheat sheet pdf can serve as a quick reference while you are learning. These resources typically summarize common signals, overbought and oversold levels, and crossover rules for the most popular indicators.
Common Mistakes Beginners Make With Indicators
New traders often approach trading indicators with enthusiasm, adding dozens of tools to their charts in search of the perfect setup. While indicators are valuable tools, there are common pitfalls that can undermine their effectiveness. Recognizing these mistakes early can save you months of frustration and help you develop a more disciplined approach to trading.
The most common mistakes beginners make include:
- Indicator overload. Adding five, six, or more indicators to a single chart creates clutter and conflicting signals. When one indicator says buy and another says sell, it becomes impossible to trade with confidence. Most professional traders use no more than two or three indicators per chart, each serving a distinct purpose.
- Ignoring market context. Applying the same indicator settings and interpretation rules regardless of market conditions leads to poor results. A signal that works well in a trending market may produce constant losses in a ranging market. Understanding whether the market is trending, ranging, or consolidating is essential before acting on indicator signals.
- Expecting perfection. Believing that indicators should be accurate 100 percent of the time leads to disappointment and frustration. Every indicator generates false signals and losing trades. Successful trading is about probabilities, not certainties. A good indicator might be right 60 percent of the time, with the remaining 40 percent managed through proper risk management.
- Using indicators without understanding them. Applying indicators without knowing how they are calculated or what they actually measure makes it difficult to trust them during losing streaks. Taking time to understand whether an indicator is leading or lagging, what inputs it uses, and what its limitations are helps you use it more effectively.
- Ignoring price action. Becoming so focused on indicators that you stop looking at price itself is a dangerous habit. Waiting for a crossover or oscillator reading without considering whether price is at a major support or resistance level, or whether a candlestick pattern is forming, leads to lower quality trades. Indicators should complement price analysis, not replace it.
- Neglecting risk management. Focusing entirely on finding the perfect indicator or signal while ignoring proper risk management is a recipe for disaster. Entering trades without stop losses, risking too much capital on a single trade, or holding losing positions hoping the indicator will eventually be proven correct are all mistakes that no indicator can overcome.
- Changing indicators too frequently. Hopping from one indicator to another after a few losses prevents you from developing consistency. Every indicator has losing periods. Constantly switching tools means you never give any system a fair chance to prove itself over a meaningful sample of trades.
- Over-optimizing settings. Adjusting indicator parameters to perfectly fit past price data creates a system that looks great in backtesting but fails in real time. Over-optimization, or curve fitting, leads to indicators that are tailored to historical noise rather than robust market behavior.
- Using indicators as a crutch. Relying entirely on indicators without developing a broader understanding of market structure, support and resistance, and risk management leaves traders vulnerable when indicators inevitably produce false signals. Indicators are tools to enhance analysis, not replacements for trading education.
- Trading every signal. Acting on every buy or sell signal an indicator generates leads to overtrading and unnecessary losses. Not every signal is worth taking. Filtering signals through additional context such as trend direction, key levels, and overall market conditions produces higher quality trades.
Practice What You Learned: Try Indicators Risk-Free with FxPro Demo
Now that you understand what are trading indicators, the best way to reinforce your knowledge is to practice in a risk-free environment. FxPro offers a free demo account that provides access to professional-grade technical indicators for forex and forex technical analysis tools across MetaTrader 4, MetaTrader 5, and cTrader platforms. This allows you to explore trading all indicators, from simple moving averages to advanced oscillators, while observing how they behave in real market conditions. You can test indicator parameters, experiment with different indicator settings, and learn how to read trading indicators without risking a single dollar of your own capital. The demo account gives you virtual funds and real-time market data, making it an ideal environment to understand forex indicators and their uses before transitioning to live trading.
As you practice, you will discover trading indicators and their uses vary depending on market conditions and trading style. Use the demo to test trading technical indicators like RSI for momentum, Bollinger Bands for volatility, and Moving Averages for trend identification. FxPro’s platforms also offer built-in trading indicators cheat sheet tools and educational resources to accelerate your learning. By dedicating time to demo practice, you will develop the confidence to apply technical indicators for forex effectively and build a solid foundation in forex technical analysis tools, all while mastering trading all indicators at your own pace.
Conclusion
Now you have a solid understanding of what are trading indicators and how they work. Trading indicators and forex indicators are mathematical calculations based on price, volume, and time that help traders analyze market conditions and make informed decisions. They are not magical tools that predict the future, but rather visual aids that transform raw market data into actionable insights. Whether you are just beginning your journey into technical analysis or looking to strengthen your foundation, understanding trading indicators is an essential step.
As you move forward, start with one or two indicators rather than cluttering your chart with multiple tools. Learn how each indicator is calculated and what it actually measures. Pay attention to market context because a signal that works in a trending market may fail in a ranging market. Most importantly, combine indicator signals with proper risk management because no indicator, no matter how accurate, can compensate for poor risk control. The best way to continue your trading education for beginners is to practice on a demo account and gradually build your confidence.
FAQ
What Are Indicators in Trading?
Indicators in trading are mathematical calculations based on price, volume, or open interest data that are displayed visually on charts to help traders analyze market conditions, identify trends, and spot potential entry and exit points.
What Are Forex Indicators?
Forex indicators are the same mathematical tools as trading indicators but applied specifically to the foreign exchange market. Popular forex indicators include Moving Averages, RSI, MACD, Bollinger Bands, and Ichimoku Cloud.
How Do Trading Indicators Work?
Trading indicators work by processing historical price and volume data through mathematical formulas to generate values plotted on charts. They produce signals through crossovers, overbought and oversold readings, divergence, and centerline crosses.
What Is Technical Analysis?
Technical analysis is the study of historical price movements and trading volumes to forecast future market behavior. Trading indicators are one of the primary tools used in technical analysis.
How Many Trading Indicators Are There?
There are hundreds of trading indicators available across different platforms. The most commonly used indicators number around 50 to 100.
Should Beginners Use Trading Indicators?
Yes, beginners should use trading indicators as part of their learning process. Starting with one or two basic indicators like moving averages and RSI helps new traders understand how these tools work.
What Is the Difference Between Trading Indicators and Forex Indicators?
There is no fundamental difference. The same mathematical tools are used across all markets. Forex indicators simply refer to trading indicators applied to currency pairs.
Do Trading Indicators Really Work?
Trading indicators work when used correctly as part of a broader trading strategy. Success comes from combining indicator signals with proper risk management, market context analysis, and consistent execution.
How Do I Learn to Read Trading Indicators?
Learning to read trading indicators involves understanding how each indicator is calculated, observing how it behaves in different market conditions, and practicing on a demo account.
Can I Trade Without Indicators?
Yes, many successful traders trade without indicators using pure price action analysis focused on candlestick patterns, support and resistance levels, and market structure.

