
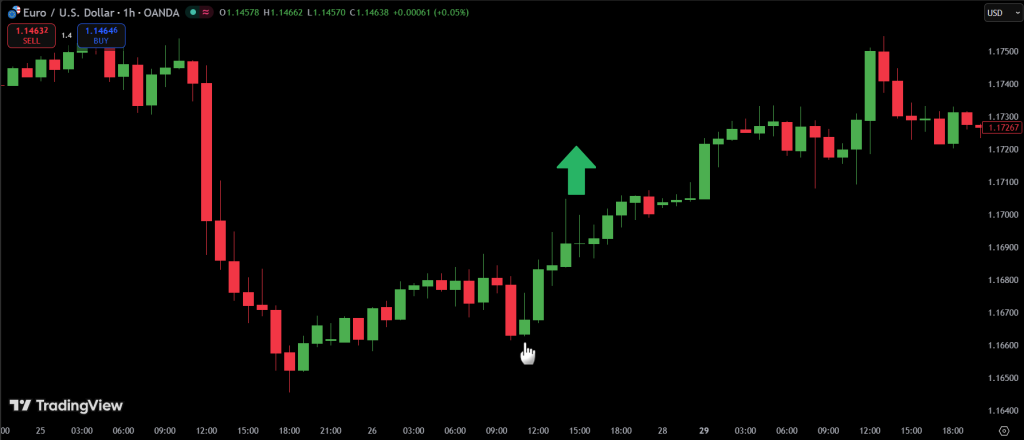
Picture a chart bleeding red. Day after day, sellers have crushed every attempt at a bounce. Then, almost out of nowhere, a strange candle appears: a tiny body hugging the lows, topped by a long, slender upper wick. This is the bullish inverted hammer pattern in its purest form. Most retail traders scroll past it, seeing nothing but noise. But the professionals stop. They zoom out. They check the trend. Because this lonely candle often marks the exact moment when the bears lose control and the first breath of buying pressure returns to the market.
That candle has a name: the inverted hammer pattern. In this guide, you will learn to recognize it, trade it, and avoid the costly trap of confusing it with its bearish twin. We will cover the psychology behind the formation, the strict rules for entry, and why most traders get it wrong simply by looking at the wrong part of the chart. By the end, you will never look at a long upper wick the same way again.
What is the Inverted Hammer Pattern? (Anatomy & Psychology)
The inverted hammer has a simple structure. The real body is small and sits near the bottom of the candle’s range. The upper wick is long, typically at least twice the length of the body. The lower wick is short or nonexistent. This shape tells a story: price traveled higher but could not hold, yet sellers failed to push it significantly lower by the close.
Color matters. A green inverted hammer pattern shows the close was above the open, indicating that buyers regained control by the session’s end. This carries stronger conviction. A inverted red hammer pattern closes lower than it opened, meaning sellers still had a presence. However, the long upper wick confirms that buyers stepped in aggressively during the session. The red version is still valid, but it demands stronger confirmation on the following candle.
The inverted hammer pattern psychology reveals a battle won by buyers despite appearances. Sellers drove price down early. Then buyers entered with force, pushing price far above the open. Though price retraced slightly by the close, the failure to make a new low signals exhaustion among sellers. This rejection of lower prices marks the beginning of accumulation.
Inverted Hammer vs. Shooting Star: How to Avoid the Fatal Mistake
Traders confuse these two patterns constantly, and the reason is simple: they look identical. Both have a small real body and a long upper wick. Both appear after a move. The difference lies entirely in context, yet traders who ignore context pay for it with losing trades.
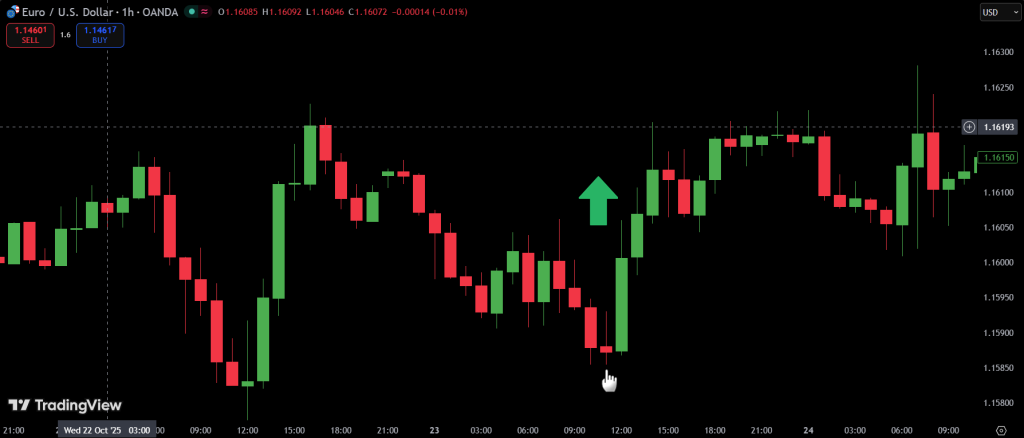
The inverted hammer pattern in downtrend is bullish. It signals that sellers have exhausted themselves and buyers are testing the waters. A shooting star appears in an uptrend and carries the opposite meaning: buyers tried to push higher but failed, and sellers are stepping in. Physically, the candles are twins. But one is a buying opportunity; the other is a sell signal.
This is where the shooting star vs inverted hammer distinction becomes critical. A trader who spots a long upper wick at the top of a rally and calls it an inverted hammer will enter a long position just as the market reverses down. The same shape in a downtrend offers a high-probability entry. A warning about the inverted hammer pattern in uptrend is worth repeating: if you see this shape after a rally, it is not an inverted hammer. It is a shooting star, and it is telling you to sell, not buy.
| Feature | Inverted Hammer | Shooting Star |
|---|---|---|
| Context | Appears in a downtrend | Appears in an uptrend |
| Signal | Bullish reversal | Bearish reversal |
| Structure | Small body, long upper wick, little lower wick | Small body, long upper wick, little lower wick |
| Psychology | Buyers rejected lower prices, exhaustion of sellers | Buyers failed to sustain higher prices, entry of sellers |
| Action | Prepare to buy | Prepare to sell or short |
The “Top” Trap: Inverted Hammer Pattern at Top
A common question among traders is what an inverted hammer pattern at top means. The answer is straightforward but often misunderstood. If a candle shaped like an inverted hammer appears at the peak of an uptrend, it is not an inverted hammer at all. Technically, it is a shooting star. The name changes because the context changes, and with it, the meaning flips entirely.
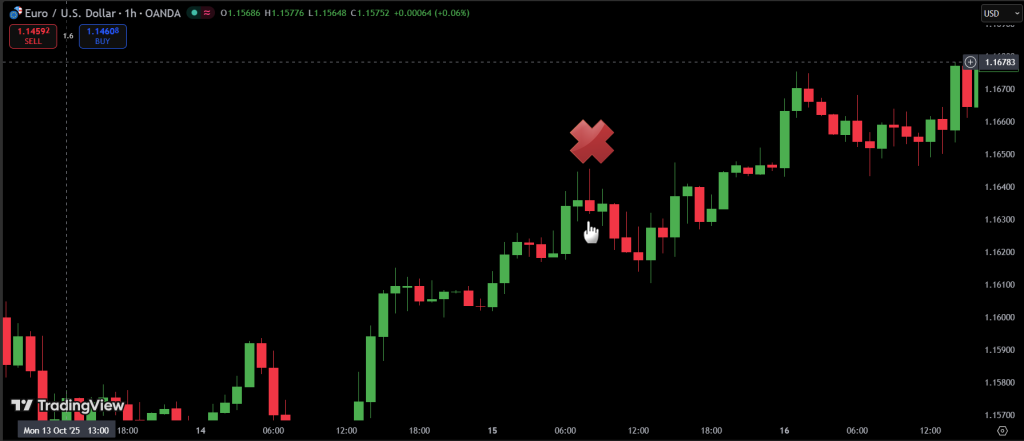
This single mislabeling is responsible for countless losing trades. A trader sees the long upper wick, remembers reading about the bullish inverted hammer, and enters a long position right as the market tops and begins to reverse downward. The pattern itself is not to blame. The failure to read the surrounding trend is. A shooting star and hammer pattern may look identical on a chart, but one belongs at the bottom of a downtrend and the other belongs at the top of an uptrend.
Context is not just important. It is everything. A hammer belongs at the bottom. An inverted hammer belongs at the bottom. If you see this shape at the top, step back and recognize it for what it truly is: a shooting star warning of a coming decline. Misreading this single detail turns a profitable signal into a guaranteed loss.
How to Trade the Inverted Hammer Pattern (Entry, Stop Loss, Target)
Spotting the pattern is only half the battle. Execution separates profitable traders from those who watch good setups turn into losses. The inverted hammer is a signal, not a trigger. Without a disciplined approach to entry, stop loss, and target, even the cleanest pattern can fail. Below is a step-by-step framework for trading it with consistency.
Step 1: Confirmation
Never trade the candle alone. The inverted hammer indicates a potential reversal, but it requires validation. Wait for a bullish confirmation candle on the next period. This means a candle that closes higher than the close of the inverted hammer, ideally with strong volume. Confirmation separates a genuine reversal from a false signal.
Step 2: Entry Points
There are two common approaches to entry, depending on risk tolerance.
- Aggressive entry: Enter at the close of the inverted hammer. This captures the earliest possible position but carries higher risk if confirmation fails.
- Conservative entry: Enter when price breaks above the high of the inverted hammer. This wait-and-see approach offers greater certainty but a slightly later entry.
Step 3: Stop Loss
Place the stop loss below the low of the inverted hammer or below the support level if you use drawing tools or indicators. This level represents the point where the pattern is invalidated. If the market breaks below this low, the rejection of lower prices failed, and the trade idea is no longer valid. In some cases, placing the stop below a nearby support level offers additional structural protection.
Step 4: Target
Profit targets can be set using several methods. Fibonacci extensions from the prior downtrend provide logical levels. Previous resistance zones offer natural areas for price to stall. A simple risk-reward ratio of 1:2 or 1:3 ensures that winners outsize losers over time. The key is to define the target before entering the trade, not after.
Timeframe Analysis: 5-Minute vs. Daily Chart
One of the most frequent questions traders ask is which timeframe works best for this pattern. The answer depends on trading style, but reliability shifts significantly across timeframes.
The inverted hammer pattern daily chart setup is the gold standard for swing traders and investors. Higher timeframes filter out market noise and carry lower failure rates. When the pattern appears on a daily or weekly chart, it represents a meaningful shift in sentiment over a longer period. For those scanning for inverted hammer pattern stocks to hold for days or weeks, the daily chart provides the most dependable signals.
On the other end of the spectrum, the inverted hammer pattern 5 min setup caters to scalpers and day traders. The pattern works on lower timeframes, but the noise level is substantially higher. False signals appear more frequently, requiring strict risk management and faster execution. A five-minute inverted hammer can offer quick opportunities, but it demands tighter stop losses and disciplined profit targets. The same rules of context and confirmation apply, but the margin for error shrinks considerably.
Practical Screening: How to Find Inverted Hammer Stocks
Finding these patterns manually by scrolling through hundreds of charts is inefficient. Stock screeners automate the search, allowing traders to focus only on setups that meet their criteria.
Platforms like Chartink provide powerful filtering options. To find stocks with bullish inverted hammer pattern, set the screener to identify stocks in a downtrend first. Then add conditions for candle shape: a small real body, a long upper wick at least twice the body length, and minimal lower wick. Some screeners offer pre-built candlestick pattern scans, including the inverted hammer pattern chartink filter, which simplifies the process further.
Once the scanner returns a list of candidates, manual verification is still essential. Check the trend context, look for confirmation on the next candle, and ensure volume supports the reversal signal. A screener is a starting point, not a substitute for judgment.
Conclusion
The inverted hammer is a powerful bullish reversal pattern, but its power comes from discipline, not hope. Three rules separate successful trades from common mistakes. First, context: the pattern must appear in a downtrend. A long upper wick at the top of an uptrend is a shooting star, not an inverted hammer. Second, confirmation: never trade the candle alone. Wait for the next candle to validate the reversal. Third, execution: define entry, stop loss, and target before entering the trade.
No pattern works every time. Even the cleanest inverted hammer can fail. But combining it with volume analysis, support and resistance levels, and proper risk management shifts the odds in your favor.
Before risking real capital, practice identifying the hammer and inverted hammer candlestick pattern on demo accounts at FXPro. Train your eyes to spot the context first, the shape second. With time and repetition, what once looked like noise will become one of the clearest signals in your trading toolkit.
FAQ
1. What is the difference between a hammer and an inverted hammer? (hammer and inverted hammer candlestick pattern)
The key difference is the position of the real body. A Hammer has a long lower wick and appears during a downtrend, signaling a bullish reversal. An Inverted Hammer has a long upper wick and also appears during a downtrend, signaling a bullish reversal based on rejection of higher prices but closing near the low.
2. What does an inverted hammer mean at the top? (inverted hammer pattern at top)
If you see a candle shaped like an inverted hammer at the top of an uptrend, it is not an inverted hammer; it is called a Shooting Star. It signals a bearish reversal, meaning prices are likely to start falling, not rising.
3. How do you trade an inverted hammer? (inverted hammer pattern entry)
The safest way is to wait for a confirmation candle. Enter a long position when the next candle closes above the high of the inverted hammer. Place a stop loss just below the low of the inverted hammer to manage risk.
4. Which stocks give an inverted hammer signal? (stocks with bullish inverted hammer pattern)
Typically, stocks that have been in a consistent downtrend and show a sudden rejection of lower prices. You can find these by using stock screeners (like Chartink) set to filter for “downtrend” + “long upper wick” + “small body.”
5. Which timeframe works best for the inverted hammer? (inverted hammer pattern 5 min / daily chart)
It works on all timeframes, but reliability increases with the timeframe. The daily chart provides the most reliable signals for swing trading and investing. The 5-minute chart can be effective for scalping but requires faster execution and carries higher noise levels.

