
The shooting star pattern is one of the most reliable bearish reversal signals in technical analysis. This single shooting star candlestick pattern appears at the top of an uptrend and warns traders that buyers are losing momentum. When you learn to recognize the bearish shooting star pattern correctly, you can spot potential trend reversals early and protect your profits. In this complete guide, you will learn how to identify the pattern, how to trade it with confirmation, and how to avoid common mistakes that trap beginner traders.
What Is a Shooting Star Candlestick?
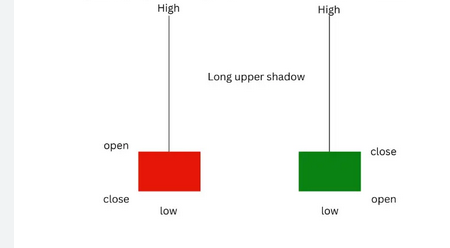
The shooting star pattern meaning is simple: after a strong uptrend, buyers try to push prices higher but fail. Sellers step in and push the price back down to near the open. The result is a candle with a long upper wick, a small real body at the bottom, and little to no lower shadow.
The shooting star candlestick pattern meaning becomes clear when you understand what the candle represents. The long upper wick shows that buyers attempted a rally but could not sustain it. The small body at the bottom tells you that sellers regained control by the close. This shift in power from buyers to sellers is what makes the pattern bearish.
Key visual features of a shooting star:
- Long upper wick (at least 2x the length of the body)
- Small real body (red or green)
- Little or no lower wick
- Appears after a clear uptrend
Example: On a daily chart, price rallies all day to a new high, then sells off aggressively to close near the open. That is a shooting star.
How to Identify: Green vs Red Shooting Star
Many beginners believe a shooting star must be red. That is not correct. The shooting star pattern can be green or red – color alone does not determine the signal’s validity.
Red Shooting Star Pattern
A red shooting star pattern occurs when the small body at the bottom is red (close below open). This is considered stronger because it shows sellers completely controlled the close. The rejection of higher prices is followed by actual selling pressure.
Green Shooting Star Pattern
A green shooting star pattern is still a valid bearish signal. The body is green (close above open), meaning buyers still had some strength at the end. However, the long upper wick still proves that a larger rally attempt failed. The signal is slightly weaker than red, but still tradable with confirmation.
Which One Is Better?
| Characteristic | Red Shooting Star | Green Shooting Star |
|---|---|---|
| Body color | Red (bearish close) | Green (bullish close) |
| Seller strength | Stronger | Moderate |
| Best used with | Confirmation only | Strong confirmation required |
The bottom line: do not ignore a shooting star just because it is green. The shooting star pattern can be green or red, focus on the structure, the long upper wick, and the uptrend context.
Where Does the Pattern Appear?
Location is everything with the shooting star. This pattern only works as a bearish signal in one specific context.
Shooting Star Pattern in Uptrend
The shooting star pattern in uptrend is the only valid setup. After a series of higher highs and higher lows, buyers become exhausted. When a shooting star appears at the peak, it signals that the uptrend may be ending. The longer the preceding uptrend, the more reliable the signal.
Shooting Star Pattern at Top
A shooting star pattern at top means the candle formed at or near a recent resistance level. The best signals occur when price touches a key horizontal resistance, a trendline, or a Fibonacci level, then rejects downward. This confluence increases the probability of a reversal.
Shooting Star Pattern in Downtrend: Does It Work?
A shooting star pattern in downtrend has no special meaning. In a downtrend, the same candle shape is called an inverted hammer (bullish reversal). Using a shooting star as a sell signal in a downtrend is a common mistake. Always check the trend first.
Hanging Man vs Shooting Star: Don’t Confuse
Another common confusion exists between the hanging man and the shooting star. Both are bearish reversal patterns that appear at the top of an uptrend, but they look different on the chart. The hanging man vs shooting star comparison is important because beginners often misidentify one for the other.
The hanging man has a small real body at the top of the candle with a long lower wick extending downward. It looks like a person hanging from a rope. The shooting star, as you already know, has a small real body at the bottom of the candle with a long upper wick extending upward. The hanging man vs shooting star candlestick pattern difference is entirely about the direction of the wick.
The hanging man warns that sellers pushed price down during the session but buyers pulled it back up by the close. The shooting star warns that buyers pushed price up during the session but sellers pulled it back down by the close. Both signals are bearish at the top of an uptrend, but their internal mechanics are different.
A hanging man suggests buying pressure still exists at the low, while a shooting star suggests selling pressure dominates the high. In practice, the shooting star is considered slightly more reliable because it shows a clear rejection of higher prices, whereas the hanging man shows a last-minute rescue by buyers. Regardless of which one appears, you should always wait for confirmation on the next candle before entering a trade.
How to Trade a Shooting Star Pattern
Trading the shooting star pattern requires a clear plan before you enter any position. You need to know exactly when to enter, where to place your stop loss, and where to take profits. The how to trade a shooting star pattern question is one of the most common among traders. Below is a step-by-step guide to trading this bearish reversal pattern.
Step-by-step trading guide:
- Identify a clear uptrend. Look for a series of higher highs and higher lows. The shooting star must appear near the top of this uptrend.
- Spot the shooting star candle. Confirm the candle has a long upper wick, a small real body at the bottom, and little to no lower shadow.
- Wait for confirmation. Do not enter immediately. Wait for the next candle to close below the low of the shooting star. This is your shooting star pattern confirmation.
- Enter the trade. For shooting star pattern entry, place a short sell order at the open of the candle following the confirmation candle. Alternatively, you can enter at the break of the shooting star low if you prefer a more aggressive approach.
- Set your stop loss. Place your stop loss a few ticks or pips above the high of the shooting star candle. If price breaks above that level, the bearish signal has failed.
- Set your profit target. For shooting star pattern target, measure the height of the prior uptrend from the lowest point to the shooting star high. Subtract that distance from the shooting star high. Alternatively, place your target at the nearest major support level.
- Manage the trade. Move your stop loss to breakeven once price reaches halfway to your target. Let the remaining profit run until your target is hit.
Confirmation Rules Before Entering
You should never enter a trade immediately when you see a shooting star. Even a perfectly formed shooting star can produce a false signal if you ignore confirmation. The shooting star pattern confirmation rule is simple: wait for the next candle to close below the low of the shooting star. This extra step filters out weak signals and keeps you out of losing trades.
A valid shooting star reversal often comes with higher than average volume on the confirmation candle, while low volume suggests weak selling interest. The signal becomes much stronger if the shooting star also formed at a key resistance level, such as a horizontal line, a trendline, or a Fibonacci retracement level. Following the shooting star pattern price action rule means letting the market prove itself before you commit your capital. Never skip confirmation.
Psychology Behind the Pattern
The shooting star pattern psychology reveals exactly why this candle predicts a bearish reversal. At the beginning of the session, buyers are still confident. They push prices higher, often creating a new high for the move. This is the long upper wick forming. But then something changes. Sellers step in aggressively and drive prices back down toward the opening level.
By the close, buyers have lost all the gains they made earlier in the session. The small real body at the bottom shows that buyers could not recover. This shift in control from buyers to sellers is what makes the shooting star a shooting star bearish reversal pattern. The psychology is simple: buyers tried and failed, sellers took over, and the trend is likely to reverse downward from here.
Common Trading Mistakes
Many traders lose money with the shooting star pattern because they make the same predictable errors. The most common mistake is trading a shooting star pattern at bottom of a downtrend, where the same candle shape is actually a bullish inverted hammer. Below are the most frequent mistakes traders make with this pattern.
Common mistakes:
- Trading the shooting star at the bottom of a downtrend instead of the top of an uptrend
- Entering immediately without waiting for the next candle to confirm
- Ignoring the trend and trading inside a sideways range
- Forgetting to check volume on the confirmation candle
- Placing the stop loss too tight, getting stopped out before the reversal continues
- Risking too much capital on a single shooting star trade
- Believing every shooting star will lead to a reversal (the shooting star pattern probability is sixty to seventy percent with confirmation, not one hundred percent)
- Trading the pattern on very low timeframes like one minute or five minutes where noise is high
Avoid these mistakes, and your success rate with the shooting star pattern will improve significantly.
Advanced Variations – Double and Doji
Sometimes the market gives you a stronger signal than a single shooting star. When two shooting stars appear back to back, or when a shooting star combines with a doji candle, the reversal signal becomes more reliable. A double shooting star pattern occurs when two consecutive candles both have long upper wicks and small bodies at the bottom.
This shows that buyers tried and failed to push higher on two separate sessions. Sellers rejected the highs twice, which makes a downward reversal much more likely. A shooting star doji pattern happens when a shooting star is followed by a doji, which is a candle with almost no body at all. The doji represents complete indecision in the market.
When indecision follows a failed rally attempt, it often precedes a strong move downward. Both of these advanced variations should still be traded with the same confirmation rules. Wait for the next candle to close below the low of the pattern before entering a short position.
Trading Across Different Assets
The shooting star pattern works on nearly any financial market, but each asset class has its own characteristics. For shooting star pattern stocks, the pattern works best on large-cap and mid-cap stocks with high trading volume. Penny stocks and illiquid shares produce too many false signals because one large order can create an artificial wick.
For shooting star pattern crypto, the pattern is reliable but you should use wider stop losses because cryptocurrencies are more volatile than stocks. Bitcoin and Ethereum show clean shooting star signals on daily and four-hour charts.
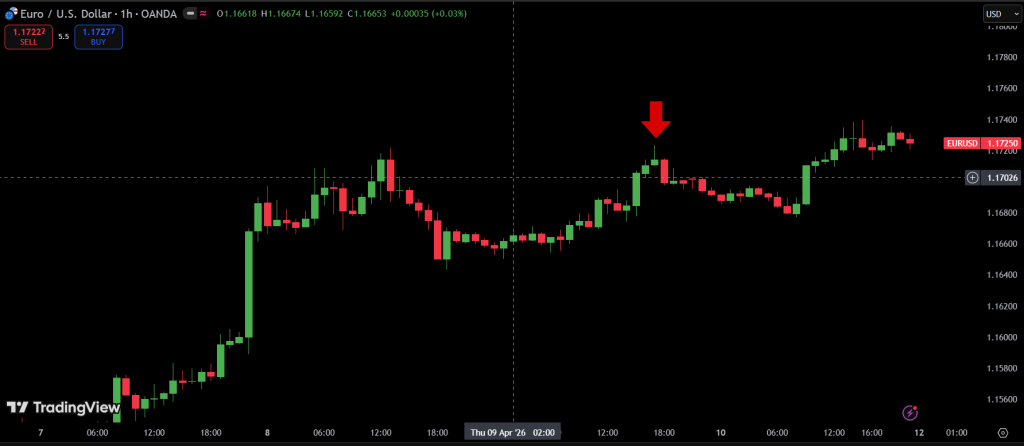
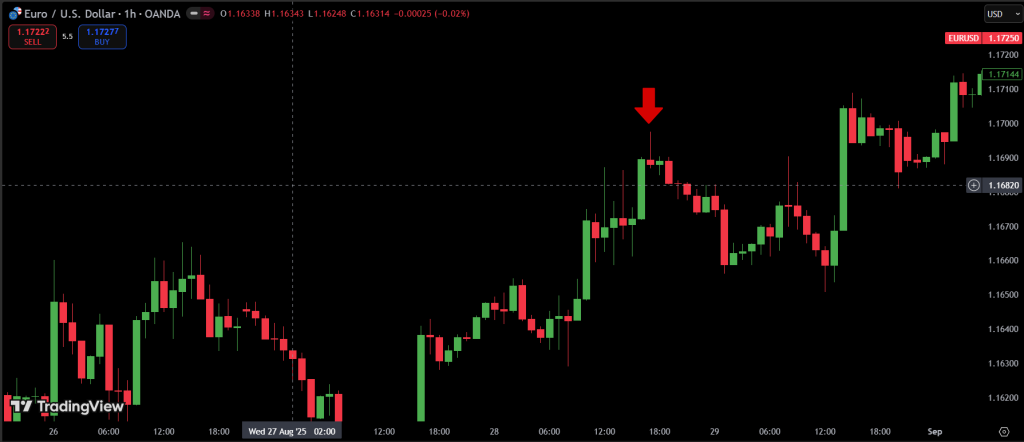
For shooting star pattern forex, the pattern works well on major pairs like EURUSD and GBPUSD, but you need confirmation more strictly because forex markets move twenty-four hours a day and the same candle can be reinterpreted as new sessions begin. Regardless of the asset, always follow the same rules: an uptrend, a shooting star candle, confirmation on the next candle, and a clear stop loss.
Best and Worst Timeframes
Not all timeframes are equal when trading the shooting star pattern. The shooting star pattern daily chart is the most reliable timeframe for this signal. Daily candles capture a full session of trading and filter out the random noise that appears on lower timeframes.
Many professional traders only trade shooting stars on the daily or weekly charts because the success rate is highest there. On the other end of the spectrum, the shooting star pattern 15 min and lower timeframes like five minutes or one minute produce many false signals.
The problem is that small timeframes are full of market noise. A shooting star on a fifteen-minute chart might reverse for twenty minutes and then continue in the original direction. If you want to trade shooting stars on lower timeframes, you should use tighter stop losses and expect a lower win rate. For beginners, sticking to the daily chart is the best approach until you gain experience with the pattern.
How to Scan for Shooting Star Patterns
You do not need to sit in front of charts all day searching for shooting stars manually. Several tools can automatically find this pattern for you. The shooting star pattern chartink scanner is a popular free option for traders in Indian and Asian markets.
Chartink allows you to create custom scans that show you all stocks with a shooting star on the daily chart. For global markets, a shooting star pattern screener is available on platforms like Finviz and TradingView. These screeners let you filter thousands of stocks in seconds and display only those with bearish reversal patterns.
A shooting star pattern scanner can also be built inside TradingView using the built-in Pine Script language or by using community-made scripts. Regardless of which tool you choose, you should always manually verify each scan result. No scanner is perfect, and some candles that look like shooting stars on a screener may not be valid when you check the full trend context. Use scanners as a starting point, not as a final trading signal.
Bitcoin and Crypto Specifics
Cryptocurrency markets have unique characteristics that affect how the shooting star pattern performs. The bitcoin shooting star pattern is particularly useful because Bitcoin leads the entire crypto market. When Bitcoin forms a shooting star on the daily or four-hour chart, most altcoins tend to follow the same direction. However, crypto markets are more volatile than stocks or forex.
A shooting star on Bitcoin can produce a sharp drop of five to ten percent in a single day. This volatility means you need wider stop losses to avoid being stopped out by normal price swings. Another crypto-specific issue is that crypto trades twenty-four hours a day, seven days a week, so the standard daily candle closes at different times depending on which exchange you use.
Many crypto traders prefer the four-hour or one-hour timeframe for shooting star signals because daily candles can be too slow in such a fast-moving market. Despite these differences, the shooting star pattern works well on Bitcoin and Ethereum when you use confirmation and respect the volatility.
Conclusion
The shooting star pattern is a powerful tool for any trader who learns to use it correctly. You now know that the shooting star pattern appears at the top of an uptrend and signals a potential bearish reversal. The shooting star candlestick pattern is defined by a long upper wick, a small body at the bottom, and little to no lower shadow.
Remember that the bearish shooting star pattern requires confirmation on the next candle closing below the shooting star low. Never trade a shooting star at the bottom of a downtrend, and never enter without confirmation.
The pattern works on stocks, crypto, and forex, with the daily chart being the most reliable timeframe. Use a scanner like Chartink or TradingView to find shooting stars automatically, but always verify the trend context manually. With practice and proper risk management, the shooting star pattern can become one of the most reliable reversal signals in your trading strategy.
FAQ – Frequently Asked Questions
This section answers the most common questions about the shooting star pattern meaning and whether the shooting star pattern bullish or bearish signal is reliable. Below are the eight most frequent questions from traders.
1. What is the difference between inverted hammer and shooting star?
The difference is the trend context. A shooting star appears at the top of an uptrend and is bearish. An inverted hammer appears at the bottom of a downtrend and is bullish. The candle shape is identical.
2. Can a shooting star be green?
Yes, a shooting star can be green or red. A green shooting star is still a bearish signal, though slightly weaker than a red one. The long upper wick is what matters most.
3. Is the shooting star pattern always a reversal?
No, it is not always a reversal. The pattern works best with confirmation. Without confirmation, the shooting star produces many false signals.
4. How to confirm a shooting star signal?
Wait for the next candle to close below the low of the shooting star candle. Higher than average volume on the confirmation candle makes the signal stronger.
5. Where can I find stocks with a shooting star pattern today?
You can use Chartink, Finviz, or TradingView screeners. These tools scan thousands of stocks and show you those with shooting star patterns.
6. What does a shooting star mean in crypto?
In crypto, a shooting star means the same as in stocks: a potential bearish reversal. The pattern works well on Bitcoin and Ethereum, but you need wider stop losses due to higher volatility.
7. What is the difference between hanging man and shooting star?
A hanging man has a small body at the top with a long lower wick. A shooting star has a small body at the bottom with a long upper wick. Both are bearish at the top of an uptrend.
8. What is the success rate of a shooting star pattern?
The success rate is approximately sixty to seventy percent when you have a clear uptrend, confirmation on the next candle, and above-average volume. Without these conditions, the rate drops below fifty percent.
