
Technical analysis offers countless tools for predicting market turns, but few are as trusted as the hammer pattern. Appearing after a decline, this single candlestick often signals that sellers have lost control and buyers are stepping in. When used correctly, it becomes a powerful component of any trader’s toolkit. In this guide, we will explore how to identify this formation, understand the psychology behind it, and apply a reliable hammer pattern trading strategy, from entry to exit, while avoiding the pitfalls that catch many beginners off guard.
What Is a Hammer Pattern?
Before trading any signal, you must first know how to recognize it. Understanding hammer candlestick anatomy is essential. The pattern consists of a single candlestick with three distinct characteristics that set it apart from other formations on the chart.
Small Body at the Top of the Range
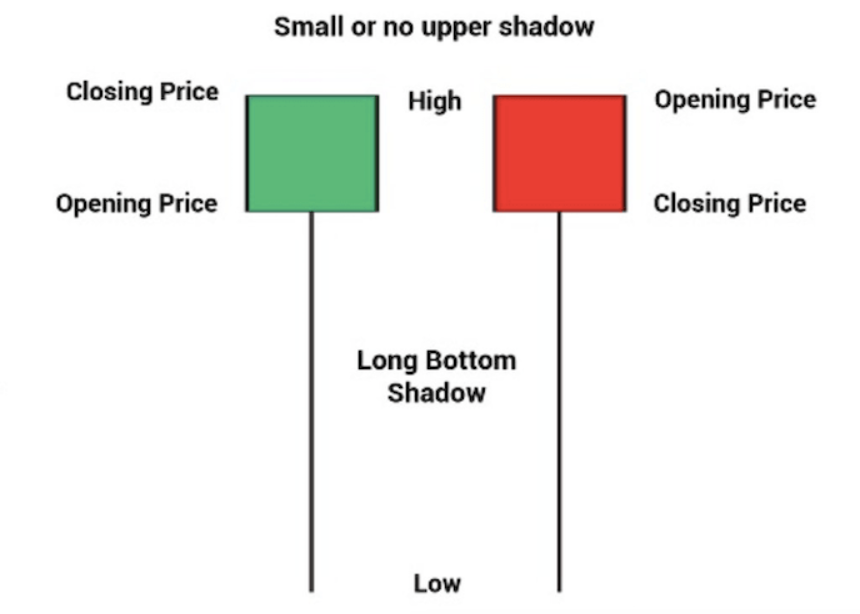
The candle opens and closes near the same price level, creating a small real body at top positioned at the upper end of the trading range. This indicates that despite any intraday fluctuations, the price ultimately settled near the session high.
Long Lower Wick
The long lower wick candlestick feature should be at least twice the length of the body. This hammer shadow to body ratio represents a significant rejection of lower prices. Sellers attempted to push the market down, but buyers aggressively stepped in and drove prices back up before the close.
Little to No Upper Wick
The upper wick, if present at all, should be very short. This confirms that sellers did not regain control after the reversal and that buying pressure persisted through the remainder of the session.
The Role of Candle Color
The color of the body offers additional clues about the strength of the reversal. A green hammer pattern indicates that buyers maintained control from the open to the close, reflecting stronger immediate conviction. A red hammer pattern shows that sellers initially pushed prices lower during the session before buyers ultimately reversed the move. While color provides useful context, it does not determine the validity of the pattern itself.
Understanding the True Meaning
More important than color is the context in which the candle appears. The true hammer pattern meaning emerges from its position within the broader trend. A hammer pattern in downtrend carries significant weight, while the same candle in an uptrend loses its reversal significance. Traders who grasp this distinction are better equipped to separate high probability setups from misleading signals.
The Psychology Behind the Formation
Every candlestick tells a story, and the hammer pattern reveals a dramatic shift in control between buyers and sellers. Understanding hammer pattern psychology and hammer pattern market sentiment is essential for traders who want to recognize not just what the pattern looks like, but what it truly represents.
The Opening: Uncertainty Prevails
When the trading session begins, there is no clear direction. The market may open near the previous close, with participants waiting for cues about where prices will move. At this stage, neither buyers nor sellers have established dominance.
The Sell Off: Sellers Take Control
During the session, sellers push prices significantly lower. This creates the long lower wick that defines the pattern. At this moment, it appears that bears are in full control, and traders who are watching may expect the decline to continue. Fear and pessimism dominate as prices test lower levels.
The Reversal: Buyers Step In
However, something changes before the session ends. Buyers enter the market aggressively, absorbing the selling pressure and driving prices back upward. This represents hammer pattern buying pressure in action. The price rallies from its lows and closes near the session high. This turnaround demonstrates that demand has entered the market at lower levels, effectively rejecting the sell off.
The Close: A Shift in Conviction
By the time the candle closes, the narrative has completely transformed. What began as a bearish session ends with a clear statement from buyers. This rejection of lower prices reflects growing hammer pattern seller exhaustion as bears lose momentum. The long wick serves as a visual reminder that sellers tried and failed to maintain control.
Why This Matters for Traders
A bullish hammer pattern does not appear in isolation. It tells traders that support has been identified at that price level. When this pattern forms after a sustained downtrend, it often signals that selling momentum is exhausted and a reversal may be imminent. Recognizing the psychological battle embedded in this single candle allows traders to anticipate potential turning points with greater confidence.
Where to Look for a Valid Hammer Pattern
Not every hammer pattern signals a reversal. The most reliable setups occur under specific market conditions where the pattern aligns with broader technical context. Knowing where to look for hammer pattern setups significantly improves your success rate.
After a Clear Downtrend
The hammer pattern derives its significance from its position within the broader trend. For a hammer to function as a reliable reversal signal, it must appear after a sustained decline where sellers have been in control for an extended period. This preceding downtrend establishes the context needed for the pattern to represent a potential shift in momentum.
When prices have been falling consistently, market sentiment leans heavily bearish. Many traders expect the decline to continue. In this environment, the appearance of a hammer suggests that selling pressure may be exhausting. The long lower wick shows that sellers attempted to push prices even lower but were met with sufficient buying interest to reverse the move.
A hammer pattern in downtrend serves as a potential exhaustion signal, indicating that the balance of power may be shifting from sellers to buyers. Without a clear preceding decline, the same candlestick shape lacks reversal context and becomes far less reliable. In fact, a hammer appearing in an uptrend or ranging market is often a false signal or represents a different pattern altogether, such as a hanging man.
Traders should look for a downtrend that is clearly visible on the chart, whether defined by lower highs and lower lows, a descending trendline, or price trading below key moving averages. The more pronounced the downtrend, the more significance the hammer carries when it finally appears.
At Key Support Levels
While a downtrend provides the necessary directional context, the most powerful hammer pattern at support level setups occur when the candle aligns with a well-established support zone. This combination of factors creates a confluence of technical evidence that increases the probability of a successful reversal.
Support levels represent areas where buying interest has historically emerged to halt declines. These zones can take several forms. A prior swing low where price reversed in the past serves as a natural support level. Moving averages, particularly the 200 period simple moving average, often act as dynamic support in trending markets. Fibonacci retracement levels, such as the 61.8 percent or 50 percent retracement, frequently mark areas where price respects technical structure. Round numbers and psychological levels also function as support zones where traders anticipate buying pressure.
When a hammer pattern with moving average support or hammer pattern with fibonacci retracement forms, the signal carries significantly more weight. The hammer itself indicates intraday rejection of lower prices, while the support level confirms that this rejection is occurring at a historically significant price zone. Together, these two elements reinforce the idea that buyers are actively defending a critical area on the chart.
The combination of a hammer following a downtrend and forming at support creates what many traders consider a high probability reversal setup. Each element alone provides useful information, but when they converge, the evidence for a potential trend change becomes compelling. This confluence allows traders to enter with greater confidence and tighter risk management.
Green Hammer vs. Red Hammer: Does Color Matter
Traders often debate whether the color of the body affects how a hammer pattern should be interpreted. Both variations can lead to successful reversals, but understanding the distinction helps refine expectations.
The Green Hammer Pattern
A green hammer pattern closes higher than it opened. Buyers maintained a net positive influence from start to finish. Despite the intraday sell off that created the long lower wick, the green close shows that buying pressure was strong enough to push prices above the opening level. This variant reflects stronger immediate conviction and often signals greater bullish momentum heading into the next session.
The Red Hammer Pattern
A red hammer pattern closes lower than it opened. Sellers had a stronger presence during the session, keeping the close below the open. However, the long lower wick still tells the same core story. Buyers stepped in aggressively to reverse the decline and drove prices back up from the lows. While the red body suggests sellers put up a fight, the pattern remains valid and can still lead to a successful reversal.
Which One Is Better
Neither color invalidates the pattern. The green hammer pattern typically signals stronger bullish momentum immediately after the signal. The red hammer pattern may indicate a more contested battle, but it still reflects rejection of lower prices. Both can work effectively when supported by a downtrend, confirmation, and a key support level. Traders should focus more on context than on candle color alone.
How to Trade the Hammer Pattern Step by Step
Identifying the pattern is only the first step. A disciplined trading plan turns a visual signal into a repeatable edge. The following framework provides a structured approach to how to trade hammer pattern from confirmation through exit.
Step 1: Wait for Confirmation
A hammer pattern alone is not a trade signal. Entering immediately on the close of the hammer often leads to false breaks and unnecessary losses. Patience is required to ensure that buyers are committed to the reversal rather than simply defending against a single session decline.
The hammer pattern confirmation comes from the next candle. This hammer pattern confirmation candle should close above the hammer’s high, not just briefly trade above it. A close above this level demonstrates that buyers are following through on the reversal attempt and are willing to push prices beyond the session high of the hammer. Hammer pattern volume analysis adds additional weight to the signal. Higher than average volume suggests genuine interest from market participants rather than a fleeting move.
Some traders wait for the confirmation candle to close before taking action, while others prefer to enter during the confirmation candle once price clearly breaks above the hammer’s high. Regardless of the approach, the key principle remains the same. Never trade the hammer without evidence that buyers are sustaining the reversal.
Step 2: Determine Your Entry
Once confirmation is established, traders have two common approaches for hammer pattern entry. Each method offers different trade offs between speed and safety.
The aggressive entry involves entering at the close of the confirmation candle. This approach ensures that the trade is active immediately after confirmation is complete. The advantage is that the trader does not miss the move if price accelerates away. The disadvantage is that the entry may be farther from the stop loss, resulting in a larger position size or a lower risk to reward ratio.
The conservative entry involves waiting for a retest of the hammer’s high after confirmation. Often, price will break above the hammer’s high, trigger the confirmation, and then pull back to retest that level as support. Entering on this retest allows for a tighter hammer pattern stop loss placement and a more favorable hammer pattern risk reward ratio. The disadvantage is that price may not retest and could continue moving higher without offering a second chance.
Both methods have merit, and the choice depends on individual risk tolerance and trading style. Traders with smaller accounts or tighter risk parameters often prefer the conservative entry, while those comfortable with more aggressive positioning may opt for the confirmation close entry.
Step 3: Set Profit Targets
Establishing hammer pattern take profit levels requires a clear understanding of where price is likely to encounter resistance. Without a defined target, traders risk holding through a reversal or exiting too early.
One common approach is to measure the prior downtrend. Traders can identify the distance from the highest point of the preceding decline to the low of the hammer. This distance is then projected upward from the hammer’s high to establish a target. This method assumes that the reversal may retrace a significant portion of the prior decline.
Another approach involves using key resistance levels. The next significant resistance zone on the higher timeframe, such as a prior swing high, a moving average, or a Fibonacci retracement level, serves as a natural target. This method relies on technical structure rather than fixed measurements.
A simpler approach is to use a hammer pattern risk reward ratio of at least 1 to 2. For example, if the hammer pattern stop loss placement is below the hammer’s low at a distance of 10 points, the target is set at 20 points above the entry. This method ensures that even with a win rate below 50 percent, the trading strategy remains profitable over time.
Common Mistakes and How to Avoid Them
Even experienced traders misinterpret the hammer pattern from time to time. Avoiding these common errors will improve consistency and prevent unnecessary losses.
- Trading hammers in an uptrend. The hammer pattern is defined as a bullish reversal signal, meaning it requires a decline to reverse. When the same candlestick shape appears in an uptrend, it is not a hammer. It is a hanging man, which carries a bearish implication. Always verify that the pattern is preceded by a clear downtrend before considering it a valid bullish signal.
- Skipping confirmation. Entering immediately on the close of the hammer is a common pitfall. The hammer represents a potential reversal, but without confirmation, it remains just that. Potential. Price may form a hammer and then continue lower in the next session if buyers fail to follow through. Waiting for hammer pattern confirmation filters out these false signals and significantly improves reliability.
- Ignoring overall market context. A hammer pattern carries more weight when aligned with broader market structure and volume. A hammer that forms at a key support level, such as a prior swing low or a moving average, is more reliable than one that appears in the middle of nowhere. Similarly, a hammer with above average volume confirms that institutional participation is behind the reversal. Incorporating these contextual factors transforms a basic candlestick pattern into a high probability hammer pattern trading strategy.
Hammer Pattern Failure Rate and False Signals
Understanding hammer pattern failure rate helps set realistic expectations. No pattern works 100 percent of the time. Even under optimal conditions, the success rate typically ranges from 60 to 70 percent.
False hammer pattern signals occur most frequently when:
- The pattern appears without a clear preceding downtrend
- Confirmation fails to materialize in the next candle
- Volume is low, indicating lack of institutional participation
- The pattern forms in the middle of a range rather than at support
When why hammer pattern fails becomes a question, the answer usually points to one of these contextual weaknesses. The most reliable hammers are those that combine a downtrend, key support, and strong confirmation.
Hammer vs. Hanging Man: What Is the Difference
New traders often confuse these two visually similar patterns. The distinction lies entirely in context, not in the shape of the candle.
- Hammer. Appears after a downtrend and signals a potential bullish reversal. The long lower wick shows buyers stepping in to reject lower prices after a decline.
- Hanging Man. Appears after an uptrend and warns of a potential bearish reversal. The same shape indicates that sellers are beginning to test the market after a prolonged rally.
Understanding the difference between hanging man and hammer pattern prevents trading against the prevailing trend. A hammer vs hanging man comparison always begins with one question. What is the trend before the candle formed?
The hammer pattern remains one of the most reliable tools in technical analysis when applied with discipline. Its value lies not in the candle itself, but in the context, a clear downtrend, support levels, and confirmation. By incorporating these elements into a structured trading plan, you can identify high-probability reversal opportunities while avoiding the common mistakes that lead to unnecessary losses. Remember, no single pattern works in isolation, but as part of a broader strategy, it can become a cornerstone of your trading approach.
Hammer Pattern in Different Markets
The pattern works across various asset classes. Here is how to apply it in different markets.
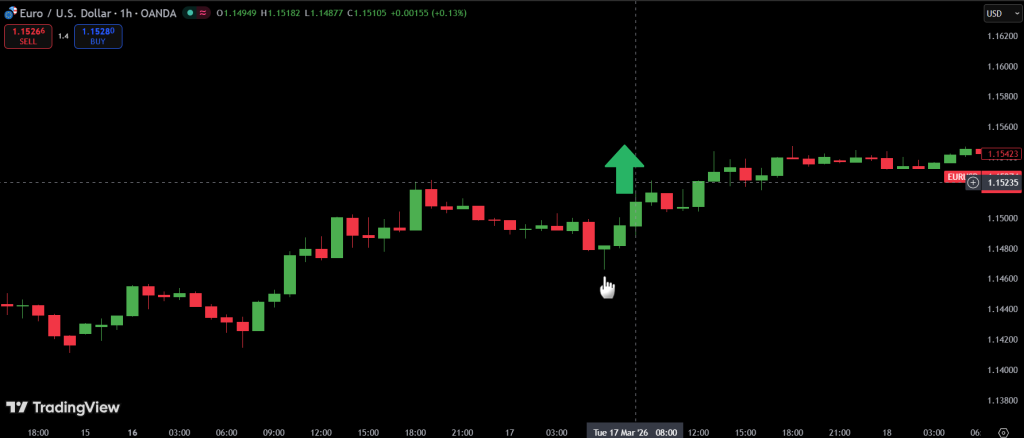
Hammer Pattern in Forex
Hammer pattern in forex is widely used across currency pairs. The 4-hour and daily timeframes tend to produce the most reliable signals. Pairs like EUR/USD, GBP/USD, and USD/JPY frequently form valid hammers at key support levels.
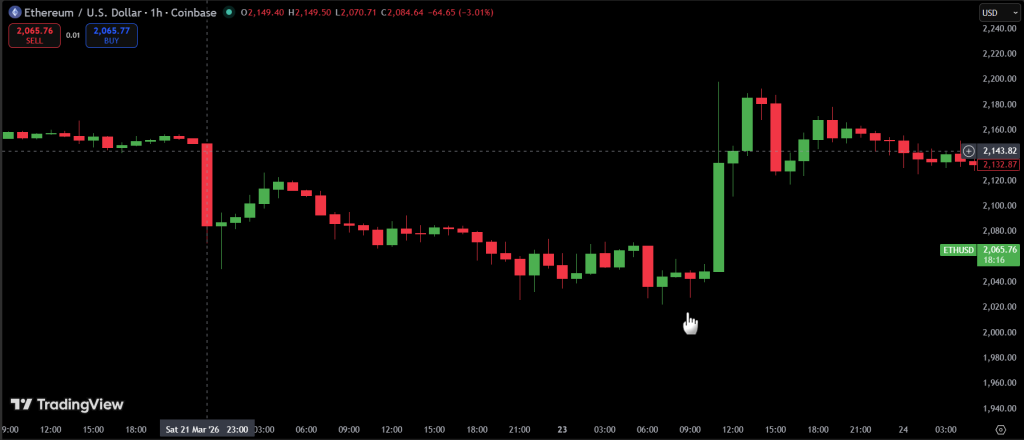
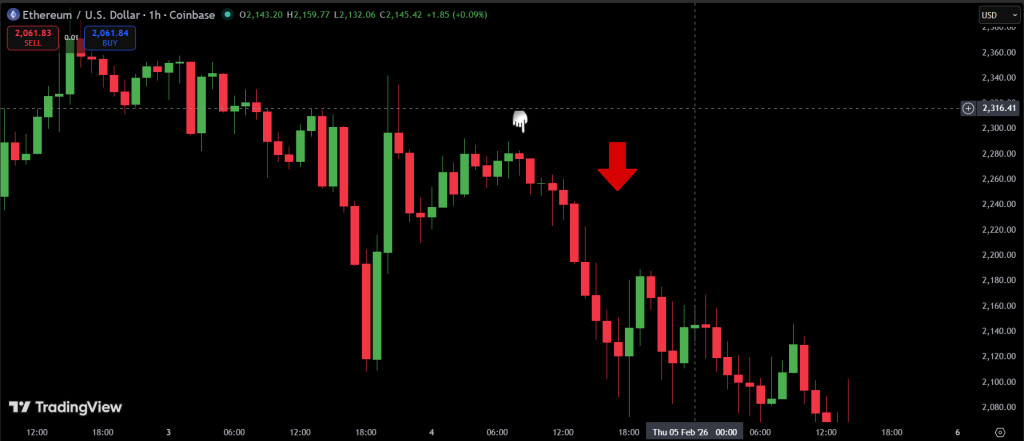
Hammer Pattern in Crypto
Hammer pattern in crypto such as hammer pattern Bitcoin or hammer pattern Ethereum can be highly effective, though crypto markets are more volatile. Using higher timeframes like 4-hour or daily helps filter out noise. A hammer pattern on Bitcoin during a downtrend often precedes sharp reversals.
Hammer Pattern on Stocks
Hammer pattern on stocks works well on individual equities, particularly liquid names like Apple, Microsoft, and Tesla. Using a hammer pattern screener can help identify stocks with this pattern across the broader market.
Hammer Pattern Gold Trading
Hammer pattern gold trading is popular among commodity traders. Gold often respects key support levels, making hammers at these zones particularly reliable.
Hammer Pattern on Indices
Hammer pattern on indices such as the S&P 500, NASDAQ, and DAX provides valuable entry signals for index traders. The daily timeframe works best for swing trading indices.
Using a Hammer Pattern Screener
Manually scanning charts for hammers is time-consuming. A hammer pattern scanner free tool can automate this process. Popular platforms like TradingView and Finviz offer screening capabilities.
A hammer pattern indicator MT4 or hammer pattern indicator TradingView can be added to your charting software to automatically highlight potential setups. The best hammer pattern finder depends on your platform preference and whether you want real-time alerts.
Setting up a hammer pattern screener settings typically involves filtering for:
- Long lower wick at least twice the body length
- Small real body near the top of the candle
- Preceding downtrend of at least 5 to 10 candles
- Volume above average
Timeframe Considerations for Hammer Pattern
The best timeframe for hammer pattern depends on your trading style. Here is a breakdown.
| Timeframe | Best For | Reliability |
|---|---|---|
| 5 minute chart | Scalping | Lower, more noise |
| 15 minute chart | Day trading | Moderate |
| 1 hour chart | Day trading | Moderate to High |
| 4 hour chart | Swing trading | High |
| Daily chart | Swing trading | Highest |
| Weekly chart | Position trading | Very High |
For hammer pattern for day trading, the 15-minute and 1-hour charts are most common. For hammer pattern swing trading, the 4-hour and daily charts provide the most reliable signals. The hammer pattern on daily chart is often considered the gold standard for reliability.
Double Hammer Pattern and Combinations
A double hammer pattern occurs when two consecutive candles both form hammer shapes. This is a stronger signal than a single hammer, indicating persistent buying pressure at the same level.
Combining the hammer with other patterns increases reliability. A hammer pattern and engulfing candle combination, where the hammer is followed by a bullish engulfing candle, provides powerful confirmation.
A hammer after doji setup indicates indecision followed by rejection of lower prices, often leading to strong reversals.
Advanced Hammer Pattern Trading
For traders seeking an edge, combining the hammer with other technical tools yields higher probability setups.
Hammer pattern with RSI divergence occurs when price makes a lower low but RSI makes a higher low. This bullish divergence combined with a hammer creates a powerful reversal signal.
Hammer pattern with MACD confirmation involves looking for bullish crossover or histogram divergence at the same time the hammer forms.
Hammer pattern confluence with support from multiple sources, such as a horizontal support level, a Fibonacci retracement, and a moving average, creates the highest probability scenario.
FAQ
What is a hammer pattern in trading
A hammer pattern is a single candlestick formation that appears after a downtrend, characterized by a small real body at the top of the range and a long lower wick at least twice the length of the body. It signals potential bullish reversal.
What to do after a hammer pattern appears
After identifying a hammer pattern, wait for hammer pattern confirmation from the next candle. Once confirmed, consider entering with a hammer pattern stop loss placement below the hammer’s low and a target based on prior resistance or a fixed hammer pattern risk reward ratio. A disciplined hammer pattern trading strategy ensures consistency across trades.
Does a hammer pattern always mean price will rise
No. The hammer pattern success rate is typically 60 to 70 percent under optimal conditions. Whether hammer pattern bullish or bearish depends entirely on context. It is bullish after a downtrend. False hammer pattern signals occur when the pattern lacks confirmation or appears without a preceding decline.
How to distinguish a hammer from a hanging man
The difference between hanging man and hammer pattern is purely contextual. A hammer forms after a downtrend and signals a potential bottom. A hanging man forms after an uptrend and warns of a potential top. The candlestick shapes are identical.
Where can I find stocks with a hammer pattern today
You can use a hammer pattern scanner free such as TradingView, Finviz, or Thinkorswim to filter for hammer pattern stocks today. Set your hammer pattern screener settings to scan for candles with a long lower wick, a small upper body, and a preceding downtrend.
What is the best timeframe for hammer pattern
The best timeframe for hammer pattern depends on your trading style. For day trading, the 15-minute and 1-hour charts work well. For swing trading, the 4-hour and hammer pattern on daily chart offer the highest reliability.
Which candle confirms a hammer pattern
The hammer pattern confirmation candle is the one immediately following the hammer. It should close above the hammer’s high, signaling that buyers have maintained control and are pushing prices higher.
What is the best entry for a hammer pattern
The hammer pattern entry can be approached in two ways. An aggressive entry takes the trade at the close of the confirmation candle. A conservative entry waits for a retest of the hammer’s high. Both methods are valid depending on risk tolerance.
How to set profit targets when trading a hammer
Establishing hammer pattern take profit levels involves measuring the prior downtrend or using key resistance levels. A common approach is to target the next significant resistance zone or to use a risk to reward ratio of at least 1 to 2.
Does the hammer pattern work in crypto
Yes. Hammer pattern in crypto, particularly hammer pattern Bitcoin and hammer pattern Ethereum, can be highly effective. Using higher timeframes like 4-hour or daily helps filter out the additional volatility in crypto markets.
What is the difference between hammer and inverted hammer
Hammer vs inverted hammer comparison: a hammer has a long lower wick and forms after a downtrend. An inverted hammer has a long upper wick and also forms after a downtrend. Both are bullish reversal signals with different visual appearances.
Can I use a hammer pattern indicator
Yes. A hammer pattern indicator MT4 or hammer pattern indicator TradingView can automatically highlight potential setups. The best hammer pattern finder depends on your platform preference.
What is the hammer pattern failure rate
The hammer pattern failure rate ranges from 30 to 40 percent under optimal conditions. Why hammer pattern fails usually relates to missing context—no clear downtrend, no support level, or no confirmation.
Is the hammer pattern good for day trading
Yes. Hammer pattern for day trading works well on lower timeframes like the 5-minute, 15-minute, and 1-hour charts. However, reliability increases with higher timeframes.

