
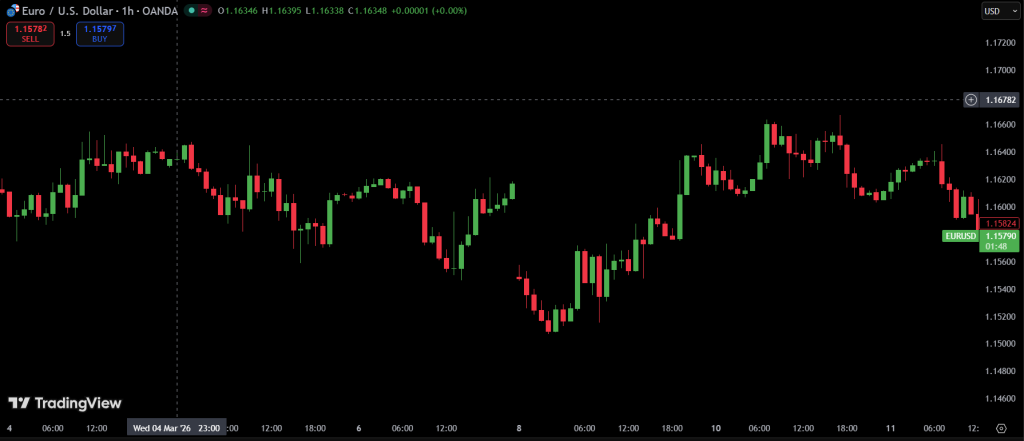
Look at any financial chart, Forex, stocks, or crypto, and you will see them: a sea of red and green shapes with wicks at the top and bottom. Japanese candlesticks are the global standard for a reason. They are the universal language of traders.
But for beginners, what are japanese candlesticks is often a confusing question. A japanese candlestick graph can look like a chaotic mess, red bars, green bars, long shadows, with no clear meaning.
This guide is here to fix that. Consider this your go-to resource for japanese candlesticks explained simply and clearly. We will strip away the confusion and give you a complete foundation for understanding japanese candlesticks, not just how they look, but how to actually use them.
You will learn where they came from, how to read their anatomy, and most importantly, the psychology that makes japanese candlesticks in trading so powerful.
Ready? Let us go.
The History of Japanese Candlesticks: The Rice Trading Revolution
To understand japanese candlesticks history, we need to travel back to 18th century Japan, long before computers, smartphones, or even the modern stock market.
The inventor of japanese candlesticks was a legendary rice trader named Munehisa Homma. Based in the port city of Sakata, Homma realized something that most traders of his era overlooked. The rice markets were driven not just by supply and demand, but by human emotion. He began tracking price movements in a visual way, mapping the open, high, low, and close of rice contracts. This method allowed him to anticipate market psychology with remarkable accuracy. The origin of japanese candlesticks is, at its core, an origin story of understanding fear and greed on a chart.
For over 200 years, Homma’s methods remained a secret of japanese rice traders candlesticks. They were used in Japan but unknown to the West. That changed in the 1990s when a technical analyst named Steve Nison introduced the concept to Western traders. When Western traders saw the shapes, tall bodies with thin lines above and below, they resembled candles complete with wicks. The name stuck, and a global standard was born.
So how old are Japanese candlesticks? More than 300 years. That is not a trend. It is a legacy. The fact that a system developed in the 1700s remains the most widely used charting method today speaks volumes about its credibility. Even the famous doji rice trading history, the pattern where open and close are nearly equal, dates back to Homma’s original observations of indecision in the rice pits.
So when you look at the japanese candlesticks origin, remember that you are using a tool refined over centuries, built on the immutable truth that markets are driven by human psychology.
Japanese Candlesticks vs. Other Chart Types
To fully appreciate why candlesticks have become the global standard, it helps to compare them against other charting methods. While several options exist, each tells a slightly different story about price.
Japanese Candlesticks vs Western Bar Charts
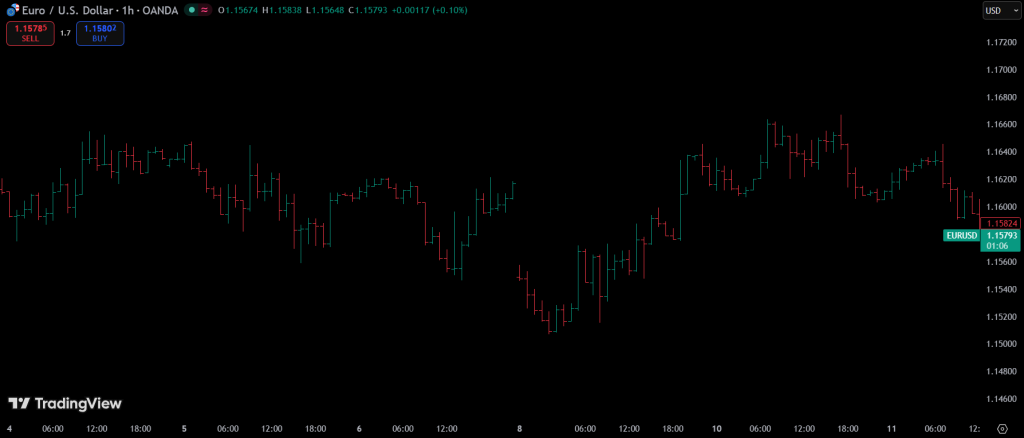
At first glance, both display the same four pieces of information: open, high, low, and close. A Western bar chart shows this as a vertical line with a small tick on the left for the open and a tick on the right for the close. It is functional but sterile. A candlestick, by contrast, uses a thick “body” to fill the space between the open and close. This visual difference is massive. With a quick glance, you can see whether buyers or sellers controlled the session. A long green body tells you bulls dominated. A long red body tells you bears crushed the market. That instant visual recognition is the reason candlesticks won out over bar charts.
Japanese Candlesticks vs Heikin Ashi
While standard candlesticks show raw price data exactly as it occurred, Heikin Ashi modifies the data. It averages price movements to create smoother, cleaner candles that filter out noise. This makes Heikin Ashi excellent for identifying trends, but it comes at a cost. Because the data is modified, Heikin Ashi candles do not reflect actual market prices. Standard Japanese candlesticks, by contrast, show you exactly what happened, warts and all. For traders who need precision and unaltered price action, traditional candlesticks remain the superior choice.
Japanese Candlesticks vs Renko
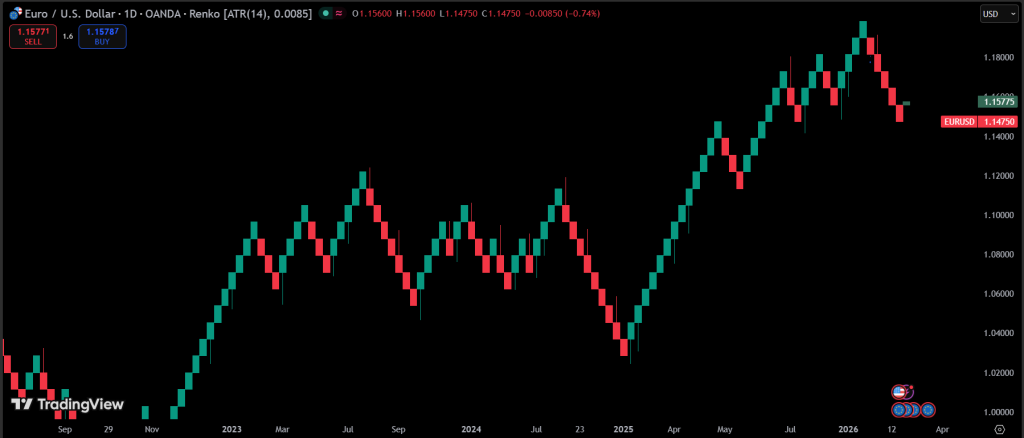
Renko charts ignore time entirely, building bricks only when price moves a set amount. This removes noise beautifully but also removes context. Japanese candlesticks, with their fixed time intervals, give you the rhythm of the market, showing you when volatility spiked, when things went quiet, and how momentum built session by session.
Each chart type has its strengths, but Japanese candlesticks strike the perfect balance. They give you raw, unaltered data with a visual design that makes the emotional battle between bulls and bears instantly readable. That is why they remain the foundation for most traders worldwide.
The Anatomy of a Japanese Candlestick
Before you can read a candlestick chart, you need to understand what you are actually looking at. Every single candle tells a story, and that story is built from just a few key components. Once you grasp the japanese candlestick anatomy, the entire chart transforms from a confusing collection of shapes into a clear narrative of market psychology.
Let us break down a japanese candlestick diagram into its physical parts.
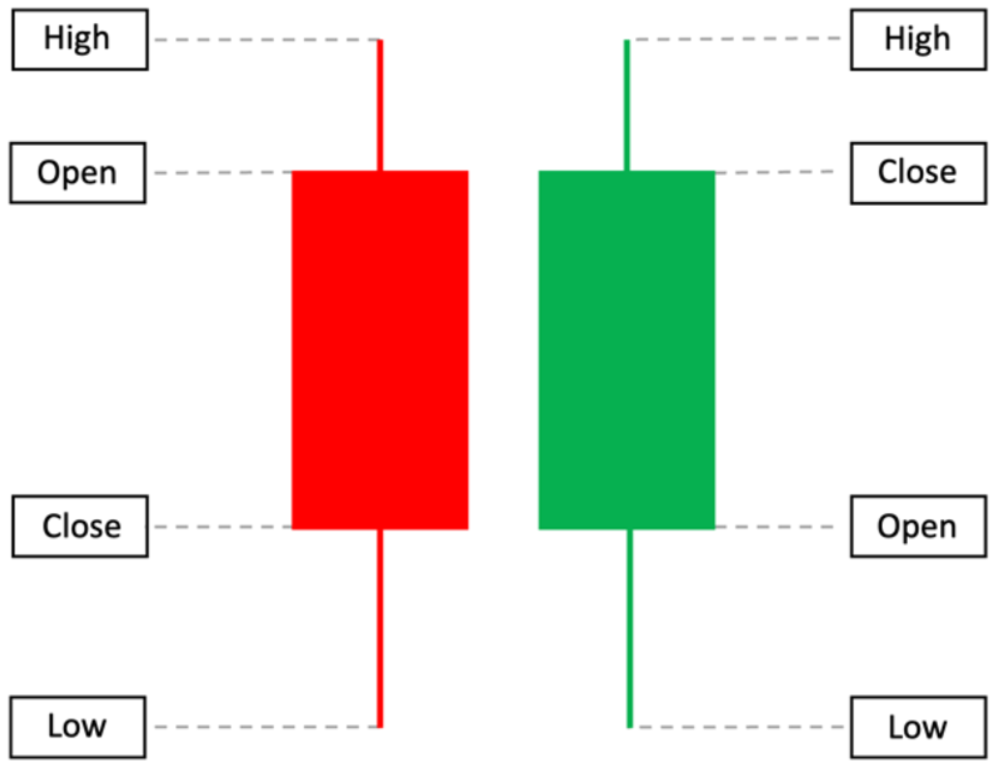
The Body
The body is the thick, rectangular area of the candle. It represents the japanese candlestick open close relationship, showing the distance between where the session opened and where it closed.
When the close is higher than the open, you get a bullish candle. Traditionally, this is shown as white or green. Buyers controlled the session and pushed prices upward by the time the period ended.
When the open is higher than the close, you get a bearish candle. Traditionally, this is shown as black or red. Sellers overwhelmed buyers and drove prices down by the close.
The size of the body tells you how forceful that control was. A long body indicates strong conviction. A short body suggests hesitation or indecision.
The Wick or Shadow
Sticking out from the top and bottom of the body are thin lines. These are called wicks or shadows. They represent the full range of price movement during the session, extending beyond where the candle ultimately opened and closed.
The upper wick shows the highest price traded during the period. When a candle has a long upper wick, it indicates that buyers pushed prices higher but could not sustain that level. Sellers stepped in and rejected those higher prices, driving the price back down.
The lower wick shows the lowest price traded during the period. When a candle has a long lower wick, it indicates that sellers pushed prices lower but lost control. Buyers stepped in, rejected those lower prices, and brought the price back up.
In both cases, wicks reveal moments of rejection. They show you where the market tried to go but ultimately failed to stay.
The Real Body
The real body is simply the area between the open and close. But its length carries significant meaning. A long real body tells you there was strong momentum in one direction. Bulls or bears were firmly in control. A short real body, sometimes called a doji, tells you there was little movement between open and close, signaling indecision or a potential turning point.
So when you look at a japanese candlestick diagram, remember what you are seeing. The body tells you who won the session. The wicks tell you what the market rejected along the way. And the relationship between them tells you the strength of that conviction. That is the foundation of japanese candlestick components, and it is the starting point for every successful candlestick trader.
How to Read Japanese Candlesticks: The Psychology of Price
Understanding the physical components of a candle is one thing. Understanding what those components actually mean is where the real power lies. To grasp how do japanese candlesticks work, you need to shift your perspective. You are no longer looking at colored shapes on a screen. You are looking at a visual representation of human emotion. Fear. Greed. Confidence. Panic. Every candle tells the story of a battle.
The Core Concept: Bulls vs. Bears
At its heart, japanese candlestick psychology is simple. There are two armies fighting in the market. The bulls are the buyers. They want prices to go up. The bears are the sellers. They want prices to go down. Every single candle is a snapshot of that battle over a specific period.
Japanese candlestick technical analysis is simply the practice of reading who won, who lost, and whether the losing side is about to strike back.
Reading the Story of a Single Candle
Let us walk through how a candle forms in real time. This is the foundation of japanese candlestick reading.
- The Open. This is where the period begins. It tells you who was in control at the start. Did the candle open near the previous close, suggesting continuity? Or did it gap higher or lower, suggesting a shift in sentiment overnight?
- The High and Low. As the session progresses, price moves. The high represents the moment buyers pushed as far as they could. The low represents the moment sellers pushed as far as they could. These extremes mark the battle lines. A long upper wick tells you buyers attacked but got pushed back. A long lower wick tells you sellers attacked but got rejected.
- The Close. This is the final score. Where price ends up tells you who won the session. A close above the open means bulls won. A close below the open means bears won. But the context matters just as much as the direction. Did the close happen at the high of the range, suggesting strong conviction? Or did it close near the middle, suggesting exhaustion?
When you practice how to analyze japanese candlesticks, you are essentially reconstructing this story candle by candle. You are asking who was in control, who tried to take over, and who ultimately walked away victorious.
Timeframes: The Psychology Scales
One of the most important concepts in how to read japanese candlesticks is understanding that the psychology scales across timeframes. The exact same formation on a 1 minute chart and a weekly chart tells the same emotional story, just on different scales.
A bullish engulfing pattern on a 5 minute chart tells you that buyers overwhelmed sellers during that 5 minute window. A bullish engulfing pattern on a weekly chart tells you that buyers overwhelmed sellers over an entire week. The timeframe you choose depends on your trading style. Scalpers live in the 1 minute and 5 minute candles. Swing traders focus on the daily and 4 hour. Long term investors watch the weekly and monthly.
The key is consistency. A candle tells a story regardless of the timeframe. The timeframe simply determines what story you are reading, the intraday skirmish or the multiyear war. Master japanese candlestick reading on one timeframe, and you can apply it to any.
Key Single Candlestick Patterns and Their Meaning
Now that you understand the anatomy of a candle and the psychology behind it, it is time to build your vocabulary. This section serves as a practical dictionary for beginners. These are the foundational single candlestick patterns you will encounter most often. Learning their japanese candlesticks meaning is the first step toward recognizing market sentiment at a glance.
The Doji
The doji is one of the most important patterns in japanese candlestick technical analysis. It forms when the open and close are nearly identical, creating a candle with virtually no real body. The japanese candlestick meaning of a doji is simple: indecision. Neither bulls nor bears could gain the upper hand during the session.
What makes the doji especially significant is its doji rice trading history. Munehisa Homma himself recognized this pattern centuries ago in the Japanese rice markets. He understood that when a session closes at or near its open, it signals a market in balance, a moment of hesitation that often precedes a reversal or a breakout.
A doji tells you to pause and pay attention. The prevailing trend may be losing steam, and a shift could be coming.
Spinning Tops
A spinning top is characterized by a small real body with long upper and lower wicks. The body can be bullish or bearish, but its size is what matters. It is small, indicating that the open and close were relatively close together despite significant price movement during the session.
The japanese candlestick meaning of a spinning top is consolidation or indecision. Like the doji, it suggests that neither bulls nor bears could take full control. However, spinning tops often appear during periods of uncertainty or before a trend continuation. They tell you that the market is catching its breath.
Marubozu
A marubozu is the opposite of a doji or spinning top. It has a long real body with little to no wicks. The upper and lower shadows, if they exist at all, are very short.
The japanese candlestick meaning of a marubozu is conviction. A bullish marubozu opens near the low, rallies throughout the session, and closes near the high. Buyers were in control from start to finish. A bearish marubozu opens near the high, sells off throughout the session, and closes near the low. Sellers dominated completely.
When you see a marubozu, you are looking at a session where one side had absolute control. It signals strong momentum and often leads to continuation in the same direction.
Hammer and Hanging Man
The hammer and hanging man are two patterns that share the exact same shape but carry opposite meanings based on context. Both have a small real body near the top of the candle and a long lower wick. The upper wick is very short or nonexistent.
The japanese candlestick meaning depends entirely on where the pattern appears. When this shape forms after a downtrend, it is called a hammer. It signals that sellers pushed prices lower during the session, but buyers stepped in aggressively and drove the price back up to close near the high. This rejection of lower prices often marks a reversal to the upside.
When the same shape forms after an uptrend, it is called a hanging man. The long lower wick shows that sellers attempted to push prices down, and while buyers managed to pull the price back up by the close, the fact that sellers attacked at all is a warning sign. The hanging man suggests that the uptrend may be weakening and a reversal could be coming.
On Japanese Candlestick Reliability
A common question among beginners is about japanese candlestick reliability. No pattern works 100 percent of the time. The market is complex, and context always matters. A hammer in a strong downtrend carries more weight than a hammer in a sideways market. A doji after a long rally is more significant than a doji in the middle of consolidation.
The key to japanese candlestick reliability is combining patterns with context. Look at the trend. Look at support and resistance. Look for confirmation in the next candle. A hammer is a signal, but waiting for a bullish follow through candle increases your odds.
When used correctly, these patterns give you a window into the psychology of the market. They tell you when one side is exhausted and the other is ready to take over. That is the real power of understanding japanese candlesticks meaning.
| Pattern | Appearance | Japanese Candlestick Meaning | Psychology | Reliability Factors |
|---|---|---|---|---|
| Doji | Open and close nearly equal. Little to no real body. | Indecision. Neither bulls nor bears controlled the session. | Market equilibrium. Both sides fought to a draw. | Most significant after a long rally or decline. Signals potential reversal or pause. |
| Long-Legged Doji | Long upper and lower wicks. Open and close near the middle. | Extreme indecision. Market moved significantly in both directions but closed flat. | Violent battle with no winner. Suggests uncertainty and potential trend change. | Strong reversal signal after a strong trend. Indicates exhaustion. |
| Gravestone Doji | Long upper wick. No lower wick. Open and close near the low. | Buyers pushed prices up but could not hold. Sellers regained control. | Failed rally. Bulls attempted but got rejected. | Bearish reversal signal, especially after an uptrend. |
| Dragonfly Doji | Long lower wick. No upper wick. Open and close near the high. | Sellers pushed prices down but could not hold. Buyers regained control. | Failed selloff. Bears attempted but got rejected. | Bullish reversal signal, especially after a downtrend. |
| Spinning Top | Small real body. Long upper and lower wicks. | Consolidation or indecision. Market is catching its breath. | Neither side could sustain momentum. Uncertainty in direction. | Appears during uncertainty. Can signal trend continuation or reversal depending on context. |
| Bullish Marubozu | Long green body. No upper wick. Little to no lower wick. | Strong buyer conviction. Bulls controlled from open to close. | Aggressive buying. No selling pressure could hold. | Indicates powerful momentum. Often leads to continuation higher. |
| Bearish Marubozu | Long red body. No lower wick. Little to no upper wick. | Strong seller conviction. Bears controlled from open to close. | Aggressive selling. No buying pressure could hold. | Indicates powerful selling pressure. Often leads to continuation lower. |
| Hammer | Small body near the top. Long lower wick. Forms after a downtrend. | Rejection of lower prices. Buyers stepped in and reversed the session. | Failed selloff. Bears tried to push lower but got overwhelmed. | Bullish reversal signal. Stronger when followed by a green confirmation candle. |
| Hanging Man | Small body near the top. Long lower wick. Forms after an uptrend. | Warning of weakening buyers. Sellers attempted a take down. | Warning sign. Bears are testing the waters. | Bearish reversal signal. Requires confirmation from a red candle next session. |
| Shooting Star | Small body near the bottom. Long upper wick. Forms after an uptrend. | Rejection of higher prices. Sellers stepped in and reversed the session. | Failed rally. Bulls tried to push higher but got overwhelmed. | Bearish reversal signal. Stronger when followed by a red confirmation candle. |
| Inverted Hammer | Small body near the bottom. Long upper wick. Forms after a downtrend. | Warning of weakening sellers. Buyers attempted a rally. | Failed selloff. Buyers are testing the waters. | Bullish reversal signal. Requires confirmation from a green candle next session. |
| Bullish Belt Hold | Long green body. No lower wick. Opens at or near the low and closes near the high. | Strong buying from the open. Bulls dominated immediately. | Aggressive buyers entered at the opening bell and never looked back. | Bullish continuation or reversal signal. Strength depends on prior trend. |
| Bearish Belt Hold | Long red body. No upper wick. Opens at or near the high and closes near the low. | Strong selling from the open. Bears dominated immediately. | Aggressive sellers entered at the opening bell and never looked back. | Bearish continuation or reversal signal. Strength depends on prior trend. |
Do Japanese Candlesticks Actually Work?
Every new trader eventually asks the same question. You have learned the history, memorized the patterns, and studied the psychology. But now comes the moment of doubt. Do these centuries old shapes actually work in modern markets? Do japanese candlesticks work in the age of algorithmic trading and cryptocurrency volatility?
The answer is yes. But perhaps not for the reasons you might expect.
Why They Work
To understand how do japanese candlesticks work, you need to look beyond the shapes themselves and into the forces they represent. Candlesticks are simply a visual representation of supply and demand. Every candle captures the battle between buyers and sellers. A long green body shows that demand overwhelmed supply. A long upper wick shows that supply entered the market and pushed price back down.
That is the first reason they work. They translate complex market dynamics into a format the human brain can process instantly.
But there is a second, more powerful reason. Candlesticks are self fulfilling prophecies. Millions of traders around the world watch the same patterns. When a hammer forms after a downtrend, thousands of traders recognize it as a potential reversal signal. They begin buying. Their collective buying pressure actually helps create the reversal the pattern predicted. The same is true for dojis, engulfing patterns, and every other well known formation.
When you ask does japanese candlesticks work, the honest answer is that they work because enough people believe they work. That belief creates the behavior that validates the pattern.
Probability vs. Certainty
No pattern works 100 percent of the time. Anyone who tells you otherwise is either inexperienced or dishonest. The market is a complex, adaptive system. Unexpected news can break any pattern. Large institutional orders can distort any formation. A hammer that looks perfect can fail spectacularly if a surprise economic report drops the next morning.
This is where japanese candlestick probability comes into play. Think of candlestick patterns as tools for shifting odds in your favor. A single candle pattern in isolation might give you a 55 percent probability of success. Combined with trend analysis, it might move to 65 percent. Add support and resistance, and you might reach 75 percent.
The goal is not to find a pattern that works every time. That pattern does not exist. The goal is to build a system where your winning trades are larger than your losing trades over time.
The Role of Statistical Analysis
For traders who want to go deeper, japanese candlestick statistical analysis provides additional confidence. Researchers have backtested candlestick patterns across decades of market data across various asset classes. The results consistently show that certain patterns, such as the bullish engulfing and bearish engulfing, have statistically significant predictive power, particularly when confirmed by trend and volume.
These studies reinforce what experienced traders already know. Candlesticks are not magic. They are a tool. Used correctly, they tilt the odds in your favor. Used blindly, without context or risk management, they will produce inconsistent results.
Why Japanese Candlesticks Are Important for Traders
Understanding why japanese candlesticks are important for traders goes beyond pattern recognition. Candlesticks teach you to think in terms of market psychology. They force you to consider who is in control, who is losing control, and where the next shift might occur.
Bar charts and line charts can tell you what price did. Candlesticks tell you how it got there. They reveal the struggle behind every move. That insight is invaluable regardless of your trading style.
So do they work? Yes. But japanese candlestick reliability depends entirely on how you use them. Treat them as signals within a broader system, combine them with other forms of analysis, and manage your risk. That is the formula that has worked for traders since Munehisa Homma first mapped the rice markets over 300 years ago.
Why Japanese Candlesticks Are the Foundation of Technical Analysis
By now, you understand the history, anatomy, and psychology behind candlesticks. But why do they hold such a central position in the world of trading? Why do nearly all technical analysis tools build upon them? The answer lies in their unmatched versatility and their role as the foundational layer for virtually every other form of market analysis.
Versatility Across Markets
One of the greatest strengths of candlesticks is that they work everywhere. Their principles are universal because human psychology is universal. Fear and greed look the same whether you are trading currencies, stocks, or digital assets.
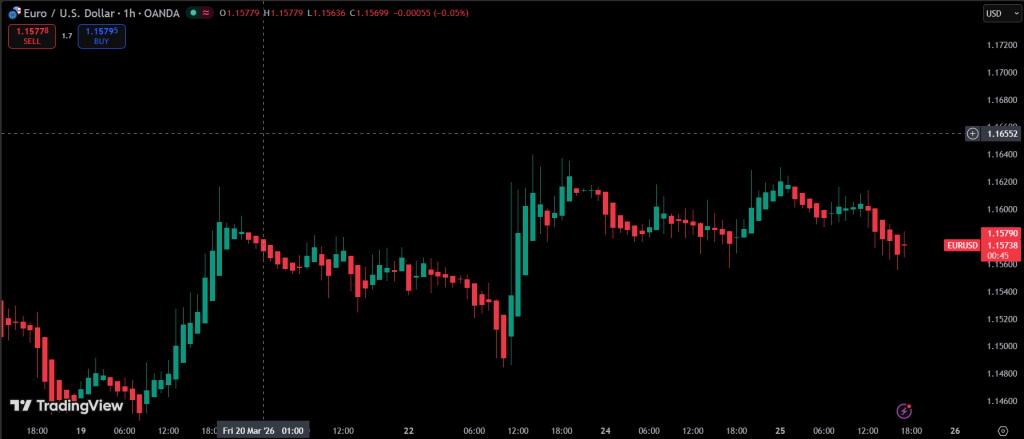
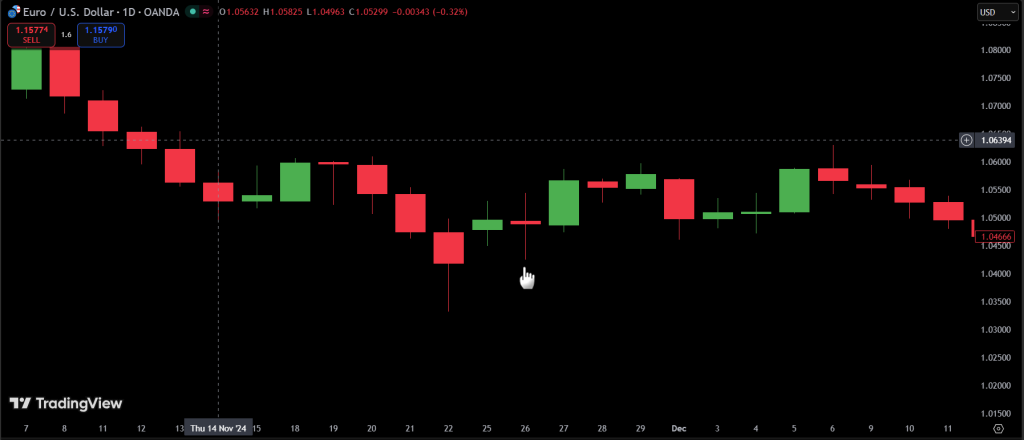
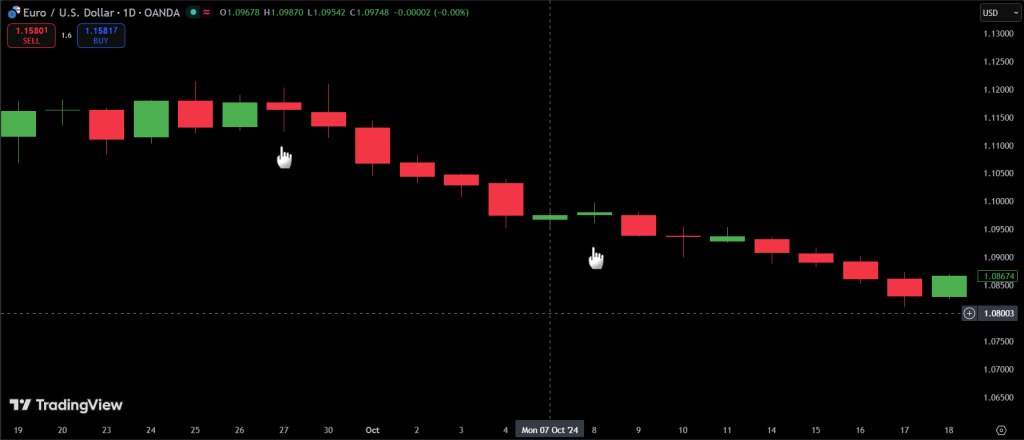
In japanese candlesticks forex, traders rely on these patterns to navigate the world’s largest financial market. The 24 hour nature of forex means candlesticks provide structure, turning the endless flow of price data into manageable, story driven sessions. Whether you are trading the Euro against the US Dollar or the British Pound against the Japanese Yen, the same hammer that worked in 18th century rice markets works today.
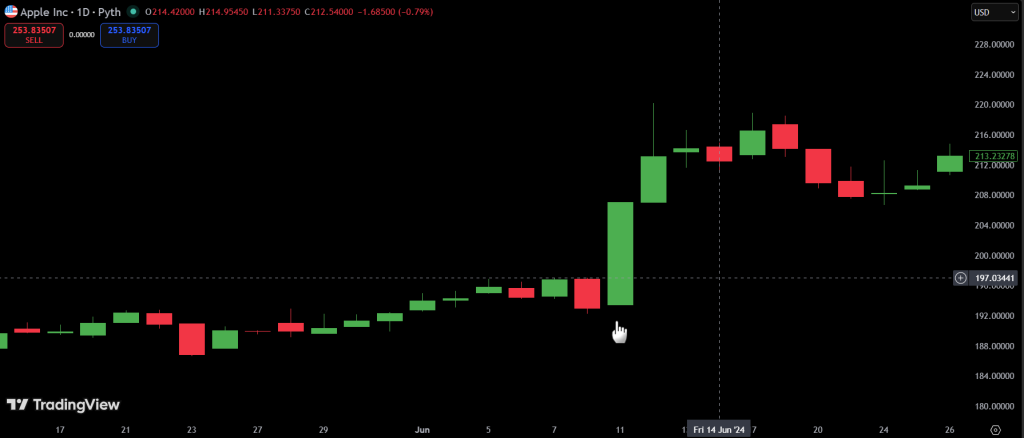
The japanese candlestick in stock market is equally essential. From day traders watching 5 minute candles on Tesla to long term investors analyzing weekly candles on Apple, the same principles apply. Candlesticks cut through the noise and reveal who is in control, institutions or retail, bulls or bears.
The same holds true for commodities, indices, and cryptocurrencies. Japanese candlestick trading has become the universal standard because it translates seamlessly across asset classes. Once you learn the language, you can read any chart.
Integration with Other Tools
Candlesticks are rarely used in isolation. Their true power lies in how they integrate with other forms of technical analysis. Think of candlesticks as the foundation upon which everything else is built.
Indicators like moving averages and the Relative Strength Index, or RSI, gain context when layered over candlestick charts. A moving average crossover is one thing. A moving average crossover occurring at the same time as a bullish engulfing candle at a key support level is something entirely different. Candlesticks provide the price action context that makes indicators actionable.
Chart patterns like head and shoulders, triangles, and flags also rely on candlesticks. Those patterns are simply formations created by a series of individual candles. Understanding the candlesticks that make up the pattern helps you gauge the strength of the breakout before it even happens.
In short, japanese candlestick in Forex, stocks, and crypto is not just a charting style. It is the visual language that underpins all other forms of technical analysis.
Conclusion
You started this japanese candlestick guide looking at a screen full of confusing red and green shapes. Now you see something entirely different. You see a japanese candlesticks chart as a historical record of market psychology, a visual narrative that stretches back over 300 years to the rice trading floors of 18th century Japan.
You have learned that Munehisa Homma, the inventor of japanese candlesticks, understood something fundamental. Markets are driven by emotion. Fear and greed leave footprints. Candlesticks simply make those footprints visible.
You now understand the anatomy of a candle, the body that shows who won the session and the wicks that show what the market rejected. You know how to read the story of open, high, low, and close. You have built a vocabulary of single candlestick patterns, from the indecision of a doji to the conviction of a marubozu, and you understand that japanese candlestick probability is about shifting odds in your favor, not finding certainty.
Final Advice for Beginners
If you are just starting out, here is the fastest way to improve your market comprehension. Master the basics. Focus on the open, high, low, and close of each candle. Learn the four major single candlestick patterns: the doji, the hammer, the shooting star, and the marubozu. Understand what each one says about the battle between bulls and bears.
Do not try to memorize every exotic pattern you find online. Start with the fundamentals. A strong foundation in japanese candlesticks for beginners is built on simplicity, not complexity. The traders who succeed are not the ones who know the most patterns. They are the ones who understand the psychology behind the patterns they use.
Your Next Step
Knowing the theory is one thing. Internalizing it is another. The best way to learn japanese candlesticks is by doing.
Open a demo account at FXPro for instance. Most brokers offer them for free. Use it to practice how to analyze japanese candlesticks in real time. Watch candles form. Ask yourself who is winning each session. Look for patterns you recognize. See what happens next.
Do this without the pressure of real money. Make mistakes in the demo account so you do not make them with your capital. Let the patterns become second nature. Let the psychology become instinct.
Because when you finally trade with real capital, you will not be guessing. You will be reading the market with clarity, confidence, and a tool that has stood the test of time for over three centuries.
That is the power of japanese candlestick trading. And now it is yours to use.
FAQ
What are Japanese candlesticks?
Japanese candlesticks are a type of financial chart used to represent the price movement of an asset. They visually display the open, high, low, and close (OHLC) for a specific time period, making it easy to see the battle between buyers and sellers. This japanese candlesticks explained approach transforms raw price data into a visual story of market psychology.
Who invented Japanese candlesticks?
The inventor of japanese candlesticks is widely credited to Munehisa Homma, a Japanese rice trader from the 18th century. He developed the method to understand the japanese candlesticks history of supply and demand in the Dojima Rice market. His work laid the foundation for what we now call japanese candlestick technical analysis.
How to read Japanese candlesticks?
To read japanese candlesticks, look at the japanese candlestick anatomy. The body shows the japanese candlestick open close range. A long body indicates strong buying or selling pressure. The japanese candlestick wick or shadow shows the high and low of the period, indicating price rejection. Mastering japanese candlestick reading is about understanding who won each session and by how much.
Do Japanese candlesticks work for day trading?
Yes, japanese candlesticks work for all timeframes, including day trading. By adjusting the japanese candlestick timeframes to 1 minute or 5 minute charts, traders use the same patterns to gauge intraday momentum and psychology. Japanese candlesticks in trading are just as effective on short timeframes as they are on daily or weekly charts.
Why are they called candlesticks?
They are called candlesticks because the combination of the rectangular body and the thin wick or shadow visually resembles a physical candle with a wick protruding from the top and bottom. This distinctive appearance is why what are japanese candlesticks is often answered with a simple description of their candle like shape.
Are Japanese candlesticks reliable?
Japanese candlestick reliability depends on context. No pattern works 100 percent of the time, but when used with trend analysis, support and resistance, and confirmation, candlesticks provide a significant edge. Understanding japanese candlestick probability helps traders avoid the mistake of expecting certainty from any single pattern.
What is the difference between Japanese candlesticks and Heikin Ashi?
When comparing japanese candlesticks vs heikin ashi, the key difference is data modification. Standard candlesticks show raw, unaltered price data. Heikin Ashi averages price movements to create smoother candles that filter out noise, but they do not reflect actual market prices. Most traders use standard candlesticks for precision and Heikin Ashi for trend clarity.
How do Japanese candlesticks work with other technical analysis tools?
Candlesticks serve as the foundation for most technical analysis. They integrate seamlessly with indicators like moving averages and RSI, and they form the building blocks of chart patterns like head and shoulders and triangles. Understanding japanese candlesticks is essential because nearly every other tool relies on the price action they display.
What is the best way to learn Japanese candlesticks for beginners?
The best japanese candlestick tutorial for beginners starts with mastering the basics: open, high, low, close, and the four major single candlestick patterns. The fastest way to learn japanese candlesticks is to practice on a demo account, watching candles form in real time and observing how patterns play out without risking real capital.
Why are Japanese candlesticks important for traders?
Why japanese candlesticks are important for traders comes down to psychology. They reveal the emotional battle between buyers and sellers in a way that bar charts and line charts cannot. This japanese candlestick guide has shown that candlesticks are not just a charting method, they are a window into market sentiment that has remained relevant for over 300 years.

