
Global financial markets are currently driven by three interconnected forces. First, the Iran–US conflict has pushed oil prices above $104 per barrel, with markets pricing a tangible risk of a Strait of Hormuz closure. This energy shock feeds directly into inflation expectations worldwide.
Second, the Federal Reserve is maintaining an ultra-hawkish stance, with traders now pricing in over a 50% chance of a rate hike by the Fed in 2026. Real yields on 10-year TIPS stand at 2.12%, which is deeply negative for non-yielding assets like gold and crypto.
Third, global liquidity is contracting as the Fed continues quantitative tightening, while crypto-specific ETF inflows have slowed dramatically. The US dollar remains the primary safe haven, overshadowing traditional hedges like gold in the short term. European and UK economies are particularly vulnerable to energy prices, creating a bearish backdrop for the euro and sterling. However, reports suggest President Trump is open to ending the Iran war without reopening the Strait of Hormuz, which has triggered a risk-on response and a modest USD pullback.
1. EUR/USD – Bearish
Macro: The euro is under pressure because Europe imports the majority of its energy, making the region highly sensitive to the $104 oil shock. The ECB is stuck at 2.15% with a weakening economy, while the Fed holds at 3.75% with a resilient US labor market. EUR/USD has halted a five-day losing streak as the USD pulls back from ten-month highs following Trump’s reported openness to ending the Iran conflict. The pair is awaiting German Retail Sales and Eurozone HICP data.
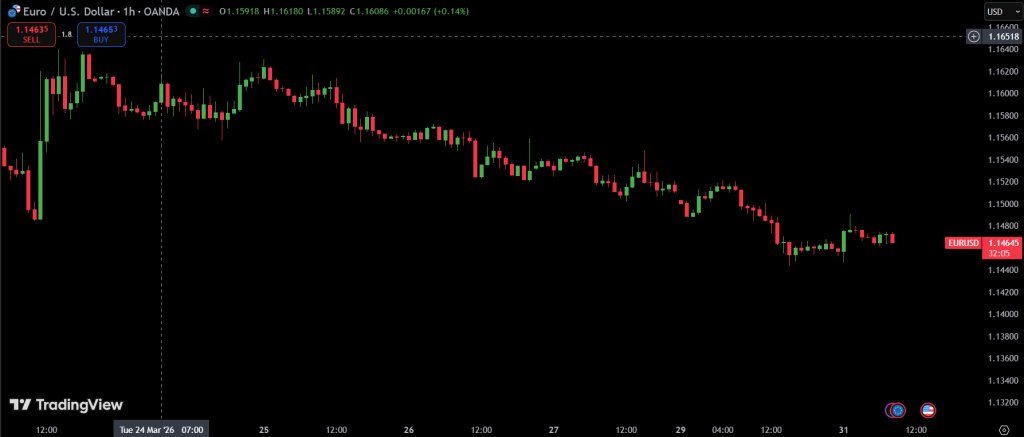
Technicals (H1): On the H1 timeframe, price is trading below the 200-period moving average, confirming bearish structure. The 50-period MA has flattened, indicating consolidation. RSI is oscillating between 40 and 55, showing weak momentum. MACD is near the zero line with flat histogram bars. Key resistance is located at 1.1520 and 1.1570. Key support sits at 1.1445 and 1.1410.
| Parameter | Value |
|---|---|
| Order Type | Sell Limit |
| Entry Price | 1.1500 |
| Stop Loss | 1.1540 |
| Take Profit 1 | 1.1445 |
| Take Profit 2 | 1.1410 |
2. GBP/USD – Bearish
Macro: The UK economy faces the worst stagflation risk among major economies due to its energy import dependency. GBP/USD rebounded from a four-month low as the USD retreated, snapping a five-day losing streak. However, upside is limited because the Bank of England’s hawkish signals raise recession risks, and escalating Middle East tensions continue to support the dollar. Markets are pricing over a 50% chance of a Fed rate hike in 2026, which should cap any meaningful sterling recovery.
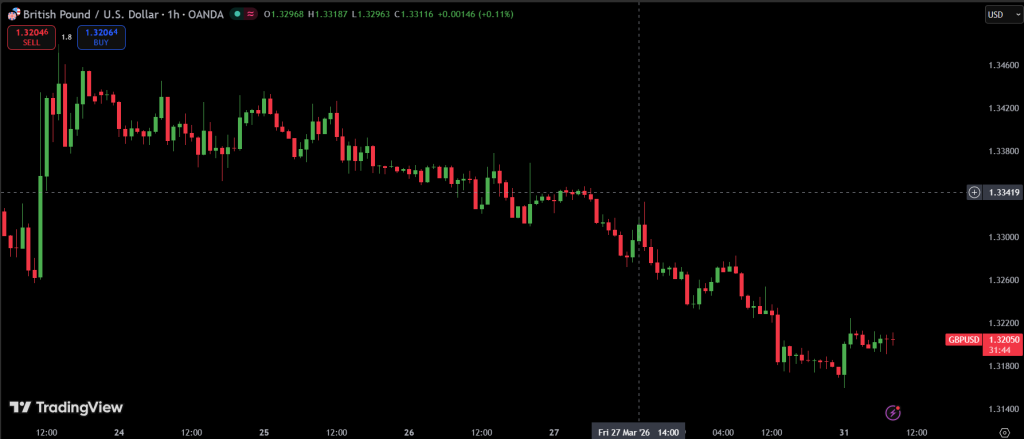
Technicals (H1): On the H1 timeframe, price has bounced from the 1.3160 support zone but remains below the 200-period moving average. The 50-period MA is sloping downward, confirming bearish momentum. RSI has recovered from oversold levels but remains below 50, indicating selling pressure persists. MACD shows a weak bullish crossover but with shallow histogram bars. Key resistance sits at 1.3220 and 1.3285. Key support sits at 1.3160 and 1.3125.
| Parameter | Value |
|---|---|
| Order Type | Sell Limit |
| Entry Price | 1.3220 |
| Stop Loss | 1.3285 |
| Take Profit 1 | 1.3160 |
| Take Profit 2 | 1.3125 |
3. XAU/USD (Gold) – Neutral to Bearish
Macro: Gold is caught between opposing forces. On one hand, safe-haven demand from the Iran conflict supports prices. On the other, rising real yields and fading Fed rate-cut hopes have put gold on track for its worst month in more than 17 years. Spot gold bounced following Trump’s reported openness to ending the Iran war, which eased some geopolitical tensions. The dollar’s pullback also provided support, but the underlying trend remains fragile.
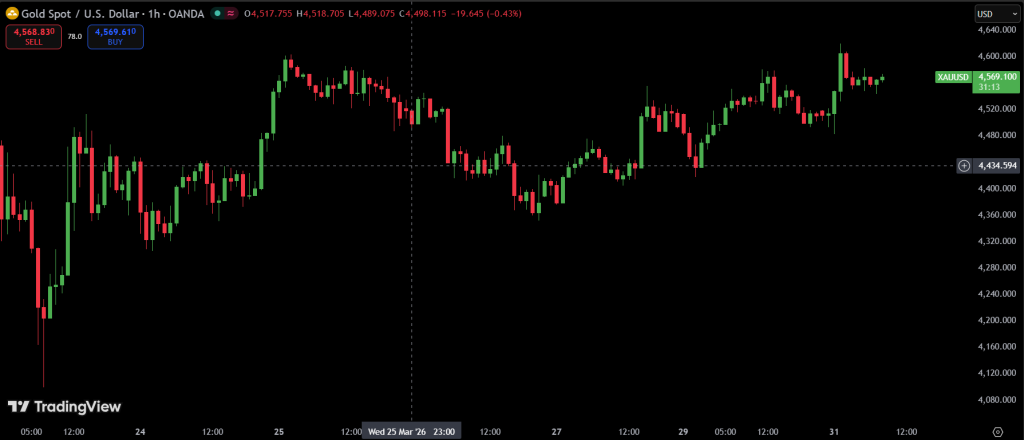
Technicals (H1): On the H1 timeframe, price is attempting to recover but faces strong resistance from the 200-period moving average. The 50-period MA is turning flat, suggesting consolidation. RSI is hovering near 50, showing indecision. MACD histogram is positive but shrinking. Key resistance sits at 4,595 and 4,630. Key support sits at 4,520 and 4,470.
| Parameter | Value |
|---|---|
| Order Type | Sell Limit |
| Entry Price | 4,595 |
| Stop Loss | 4,630 |
| Take Profit 1 | 4,520 |
| Take Profit 2 | 4,470 |
4. BTC/USD (Bitcoin) – Bearish
Macro: Bitcoin’s recovery is attributed to the broader risk-on sentiment following Trump’s Iran comments, which triggered a USD pullback. However, the macro backdrop remains challenging: rising real yields make risk-free US Treasuries attractive at 4.40%, pulling speculative capital away from crypto. ETF inflows have slowed, and the absorption-to-emission ratio has dropped sharply, indicating that miner selling is barely being absorbed.
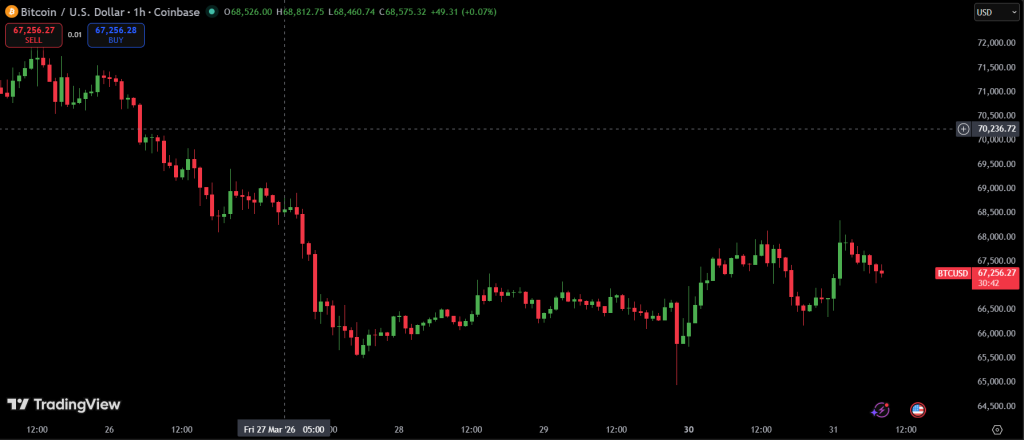
Technicals (H1): On the H1 timeframe, price has broken above a short-term bearish trend line but remains below the 200-period moving average. The 50-period MA is sloping upward but has not crossed above the 200-period MA. RSI is near 55, showing modest bullish momentum. MACD is positive with rising histogram bars. Key resistance sits at 68,500 and 69,500. Key support sits at 66,800 and 65,000.
| Parameter | Value |
|---|---|
| Order Type | Sell Stop |
| Entry Price | 66,800 |
| Stop Loss | 68,500 |
| Take Profit 1 | 66,000 |
| Take Profit 2 | 65,000 |
5. ETH/USD (Ethereum) – Bearish
Macro: Ethereum shares Bitcoin’s macro sensitivity but with weaker fundamentals. ETH has seen substantial ETF outflows recently, and on-chain data shows no whale accumulation at current levels. Gas fees remain low, indicating weak network activity. The broader crypto market is seeing a modest recovery as risk sentiment improves following Trump’s Iran comments, but the structural bear case remains intact.
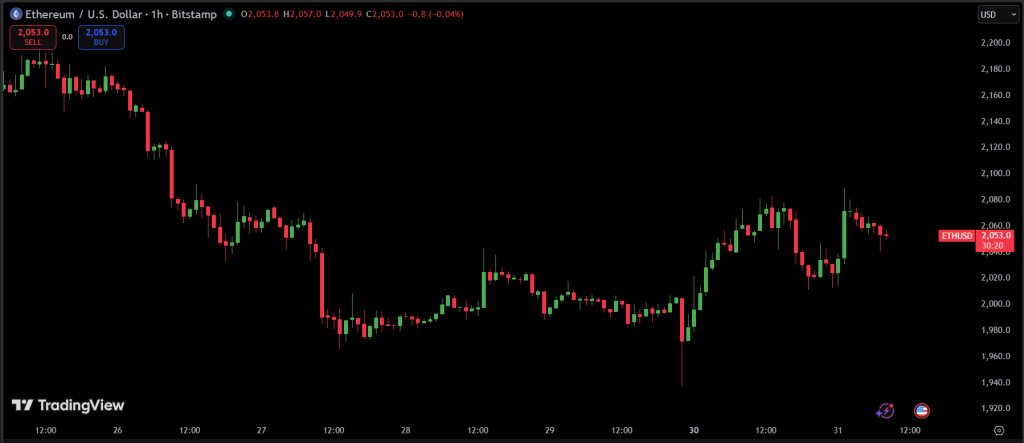
Technicals (H1): On the H1 timeframe, price is attempting to recover but remains below the 200-period moving average. The 50-period MA has crossed above the 100-period MA but not the 200-period MA, indicating a short-term bounce within a longer-term downtrend. RSI is near 55, showing moderate buying pressure. MACD is positive but histogram bars are flattening. Key resistance sits at 2,050 and 2,100. Key support sits at 1,990 and 1,920.
| Parameter | Value |
|---|---|
| Order Type | Sell Stop |
| Entry Price | 1,990 |
| Stop Loss | 2,050 |
| Take Profit 1 | 1,920 |
| Take Profit 2 | 1,850 |
6. WTI Crude Oil (USOIL) – Bullish
Macro: Oil is the primary beneficiary of the Iran–US conflict. WTI has surged more than 50% this month, marking its largest monthly gain since May 2020. President Trump has threatened to eliminate Iranian power plants, oil fields, and Kharg Island if the Strait of Hormuz is not reopened. Some forecasts suggest oil could reach $150 if the blockade continues. However, Trump is also reportedly open to ending the war without reopening the strait, creating a mixed outlook.
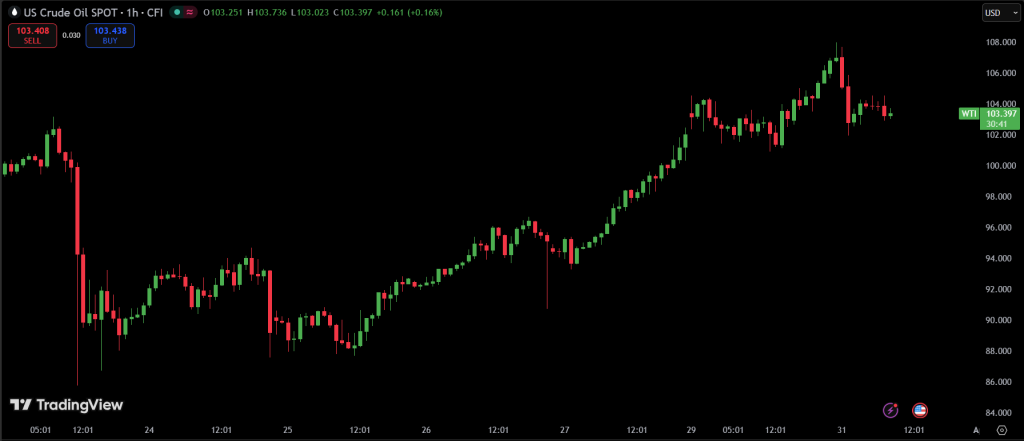
Technicals (H1): On the H1 timeframe, price is trading well above all major moving averages, with the 50, 100, and 200-period MAs in a strong bullish alignment. RSI is approaching overbought territory near 70, suggesting a pullback is likely before the next leg higher. MACD is positive but histogram bars are showing early signs of divergence. Key resistance sits at 106.50 and 109.00. Key support sits at 103.50 and 101.50.
| Parameter | Value |
|---|---|
| Order Type | Buy Limit |
| Entry Price | 103.50 |
| Stop Loss | 101.50 |
| Take Profit 1 | 106.50 |
| Take Profit 2 | 109.00 |
SUMMARY TABLE
| Asset | Order Type | Entry | Stop Loss | TP1 | TP2 |
|---|---|---|---|---|---|
| EUR/USD | Sell Limit | 1.1500 | 1.1540 | 1.1445 | 1.1410 |
| GBP/USD | Sell Limit | 1.3220 | 1.3285 | 1.3160 | 1.3125 |
| XAU/USD | Sell Limit | 4,595 | 4,630 | 4,520 | 4,470 |
| BTC/USD | Sell Stop | 66,800 | 68,500 | 66,000 | 65,000 |
| ETH/USD | Sell Stop | 1,990 | 2,050 | 1,920 | 1,850 |
| WTI | Buy Limit | 103.50 | 101.50 | 106.50 | 109.00 |
Key events to monitor today: German Retail Sales, Eurozone HICP data, US JOLTS Job Openings, and any further headlines on Iran conflict negotiations. Any diplomatic breakthrough could invalidate these pending orders. Adjust or cancel orders if market structure changes significantly.

